
Predicting Substack Growth: How Long Before You Hit a Wall?

Paid newsletters are fundamentally subscription businesses. Their growth relies on a simple truth: new paying readers must arrive faster than existing ones leave.
While this sounds obvious, it introduces a critical mathematical reality: even if a publication consistently acquires new subscribers every month, net growth will flatten if cancellations rise alongside the growing subscriber base.
This model is generalizable to any subscription product where:
New paid subscribers arrive at an average daily rate (x).
Existing paid subscribers cancel at an average per-subscriber rate (c).
By using my own Substack export as a case study, we can test these principles against a concrete subscriber curve.
Case Study: My Substack Data
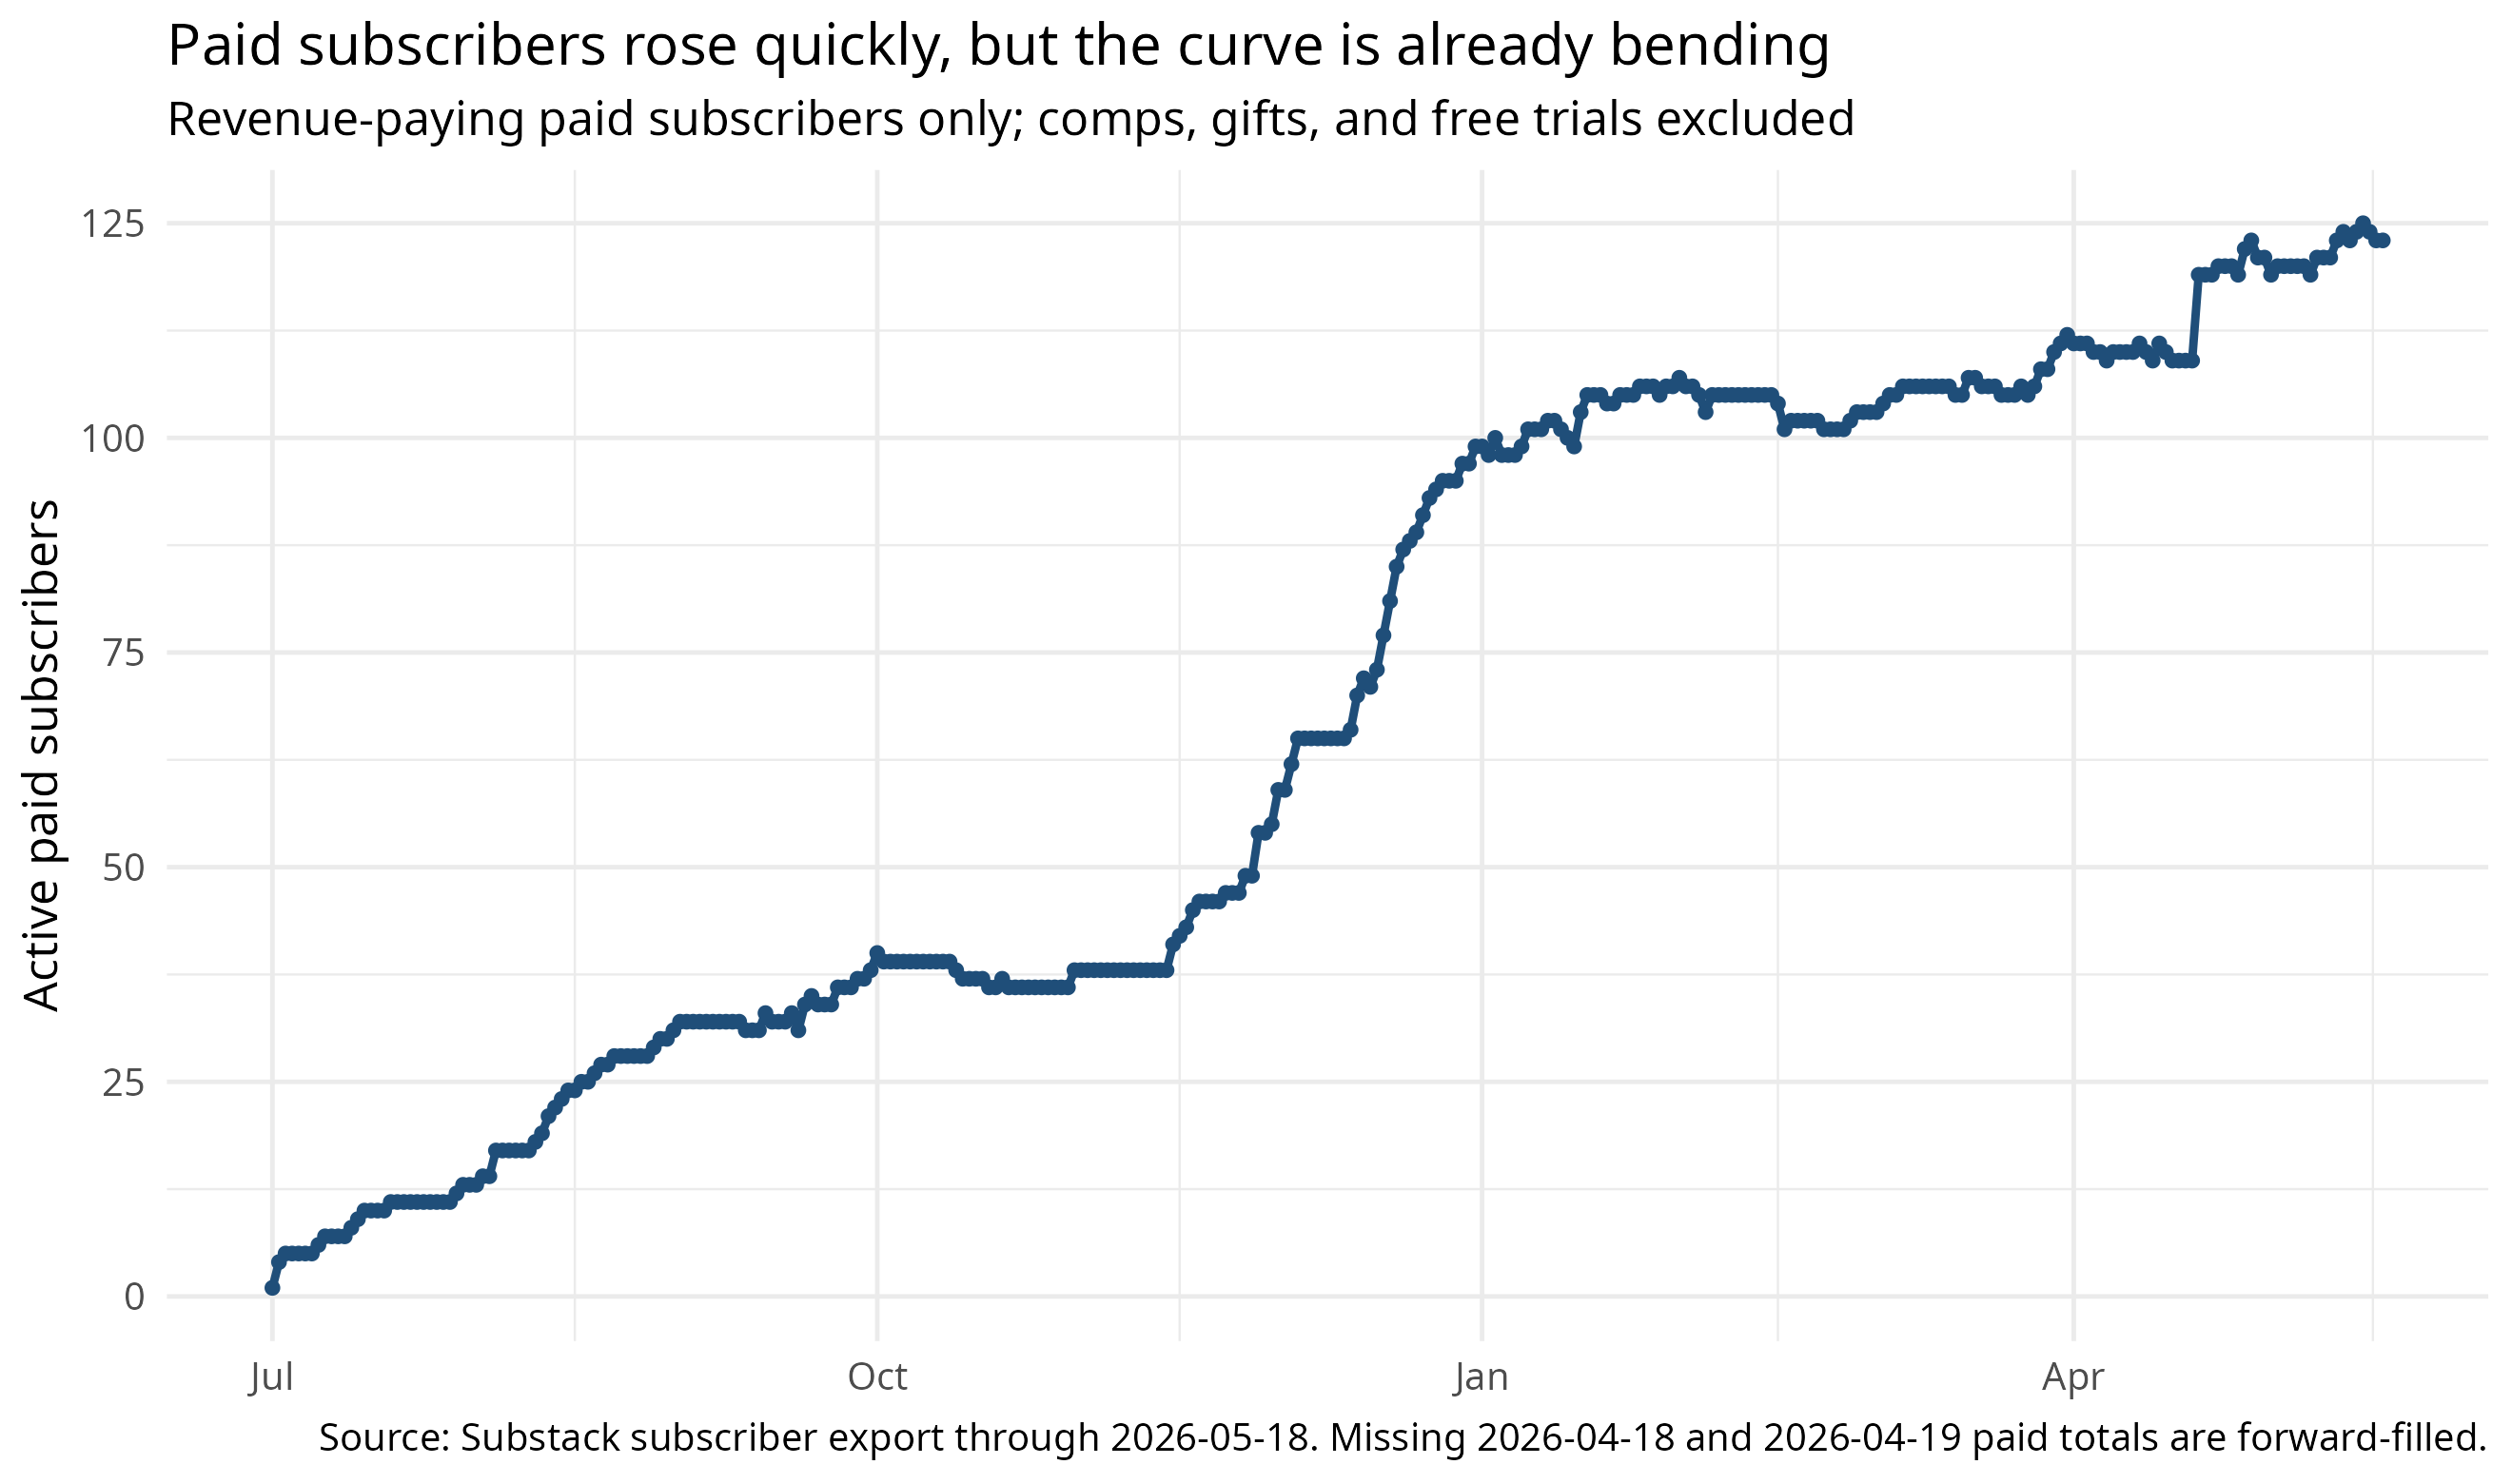
When applied to my actual data, the model reveals that the current growth curve is not exponential.
The Baseline Forecast
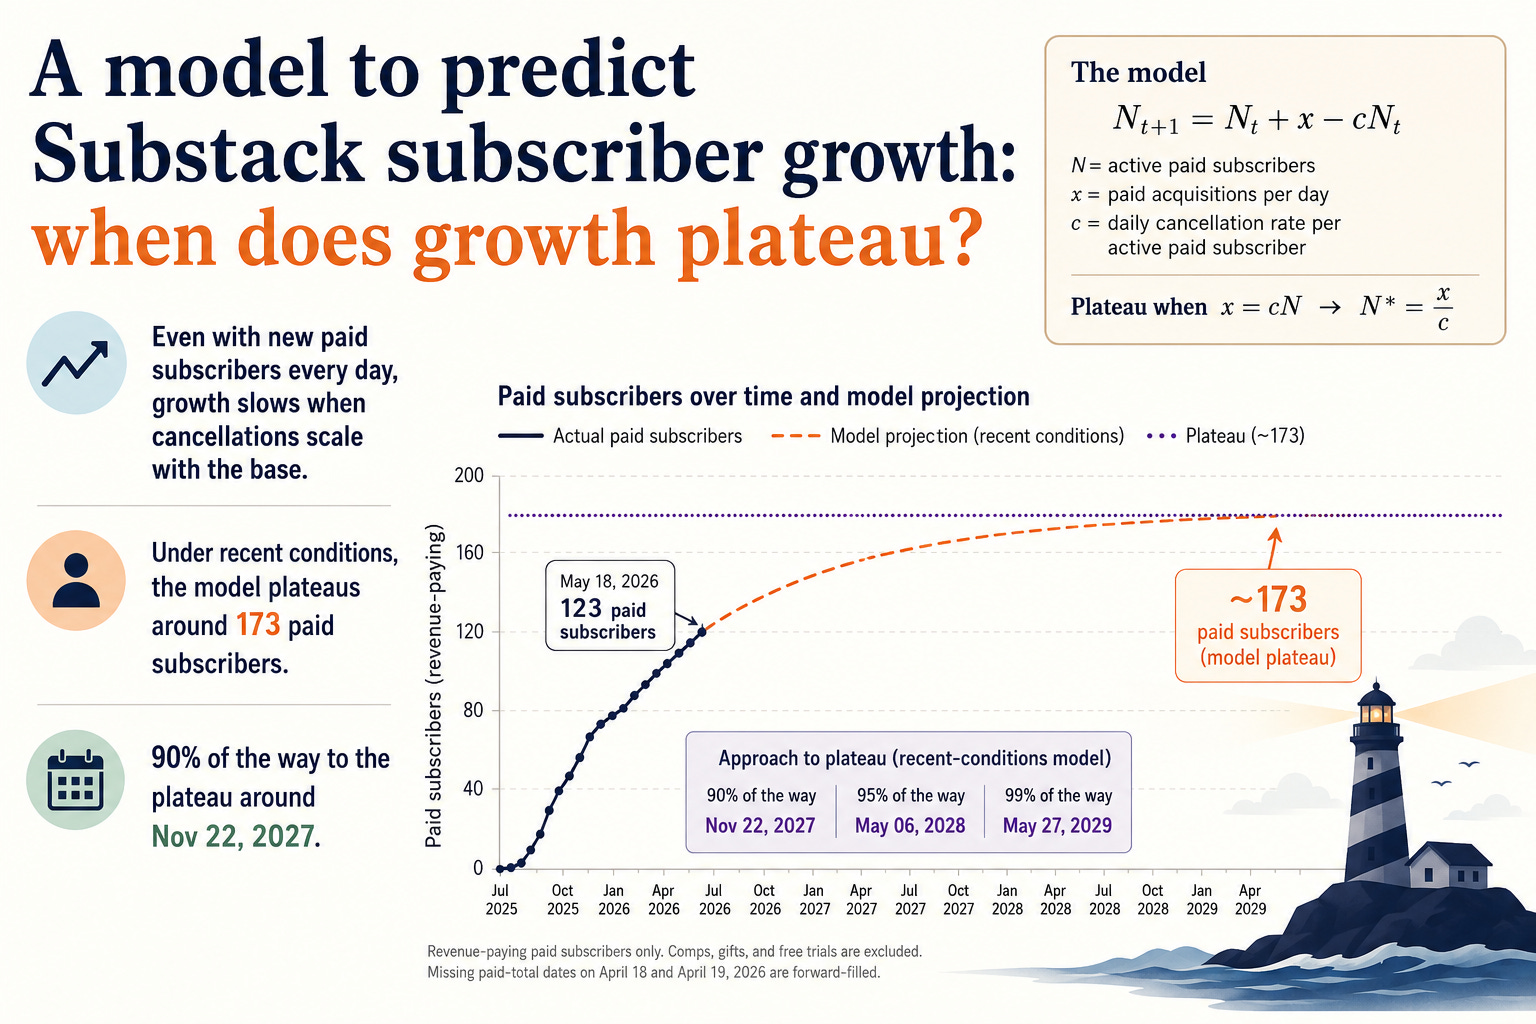
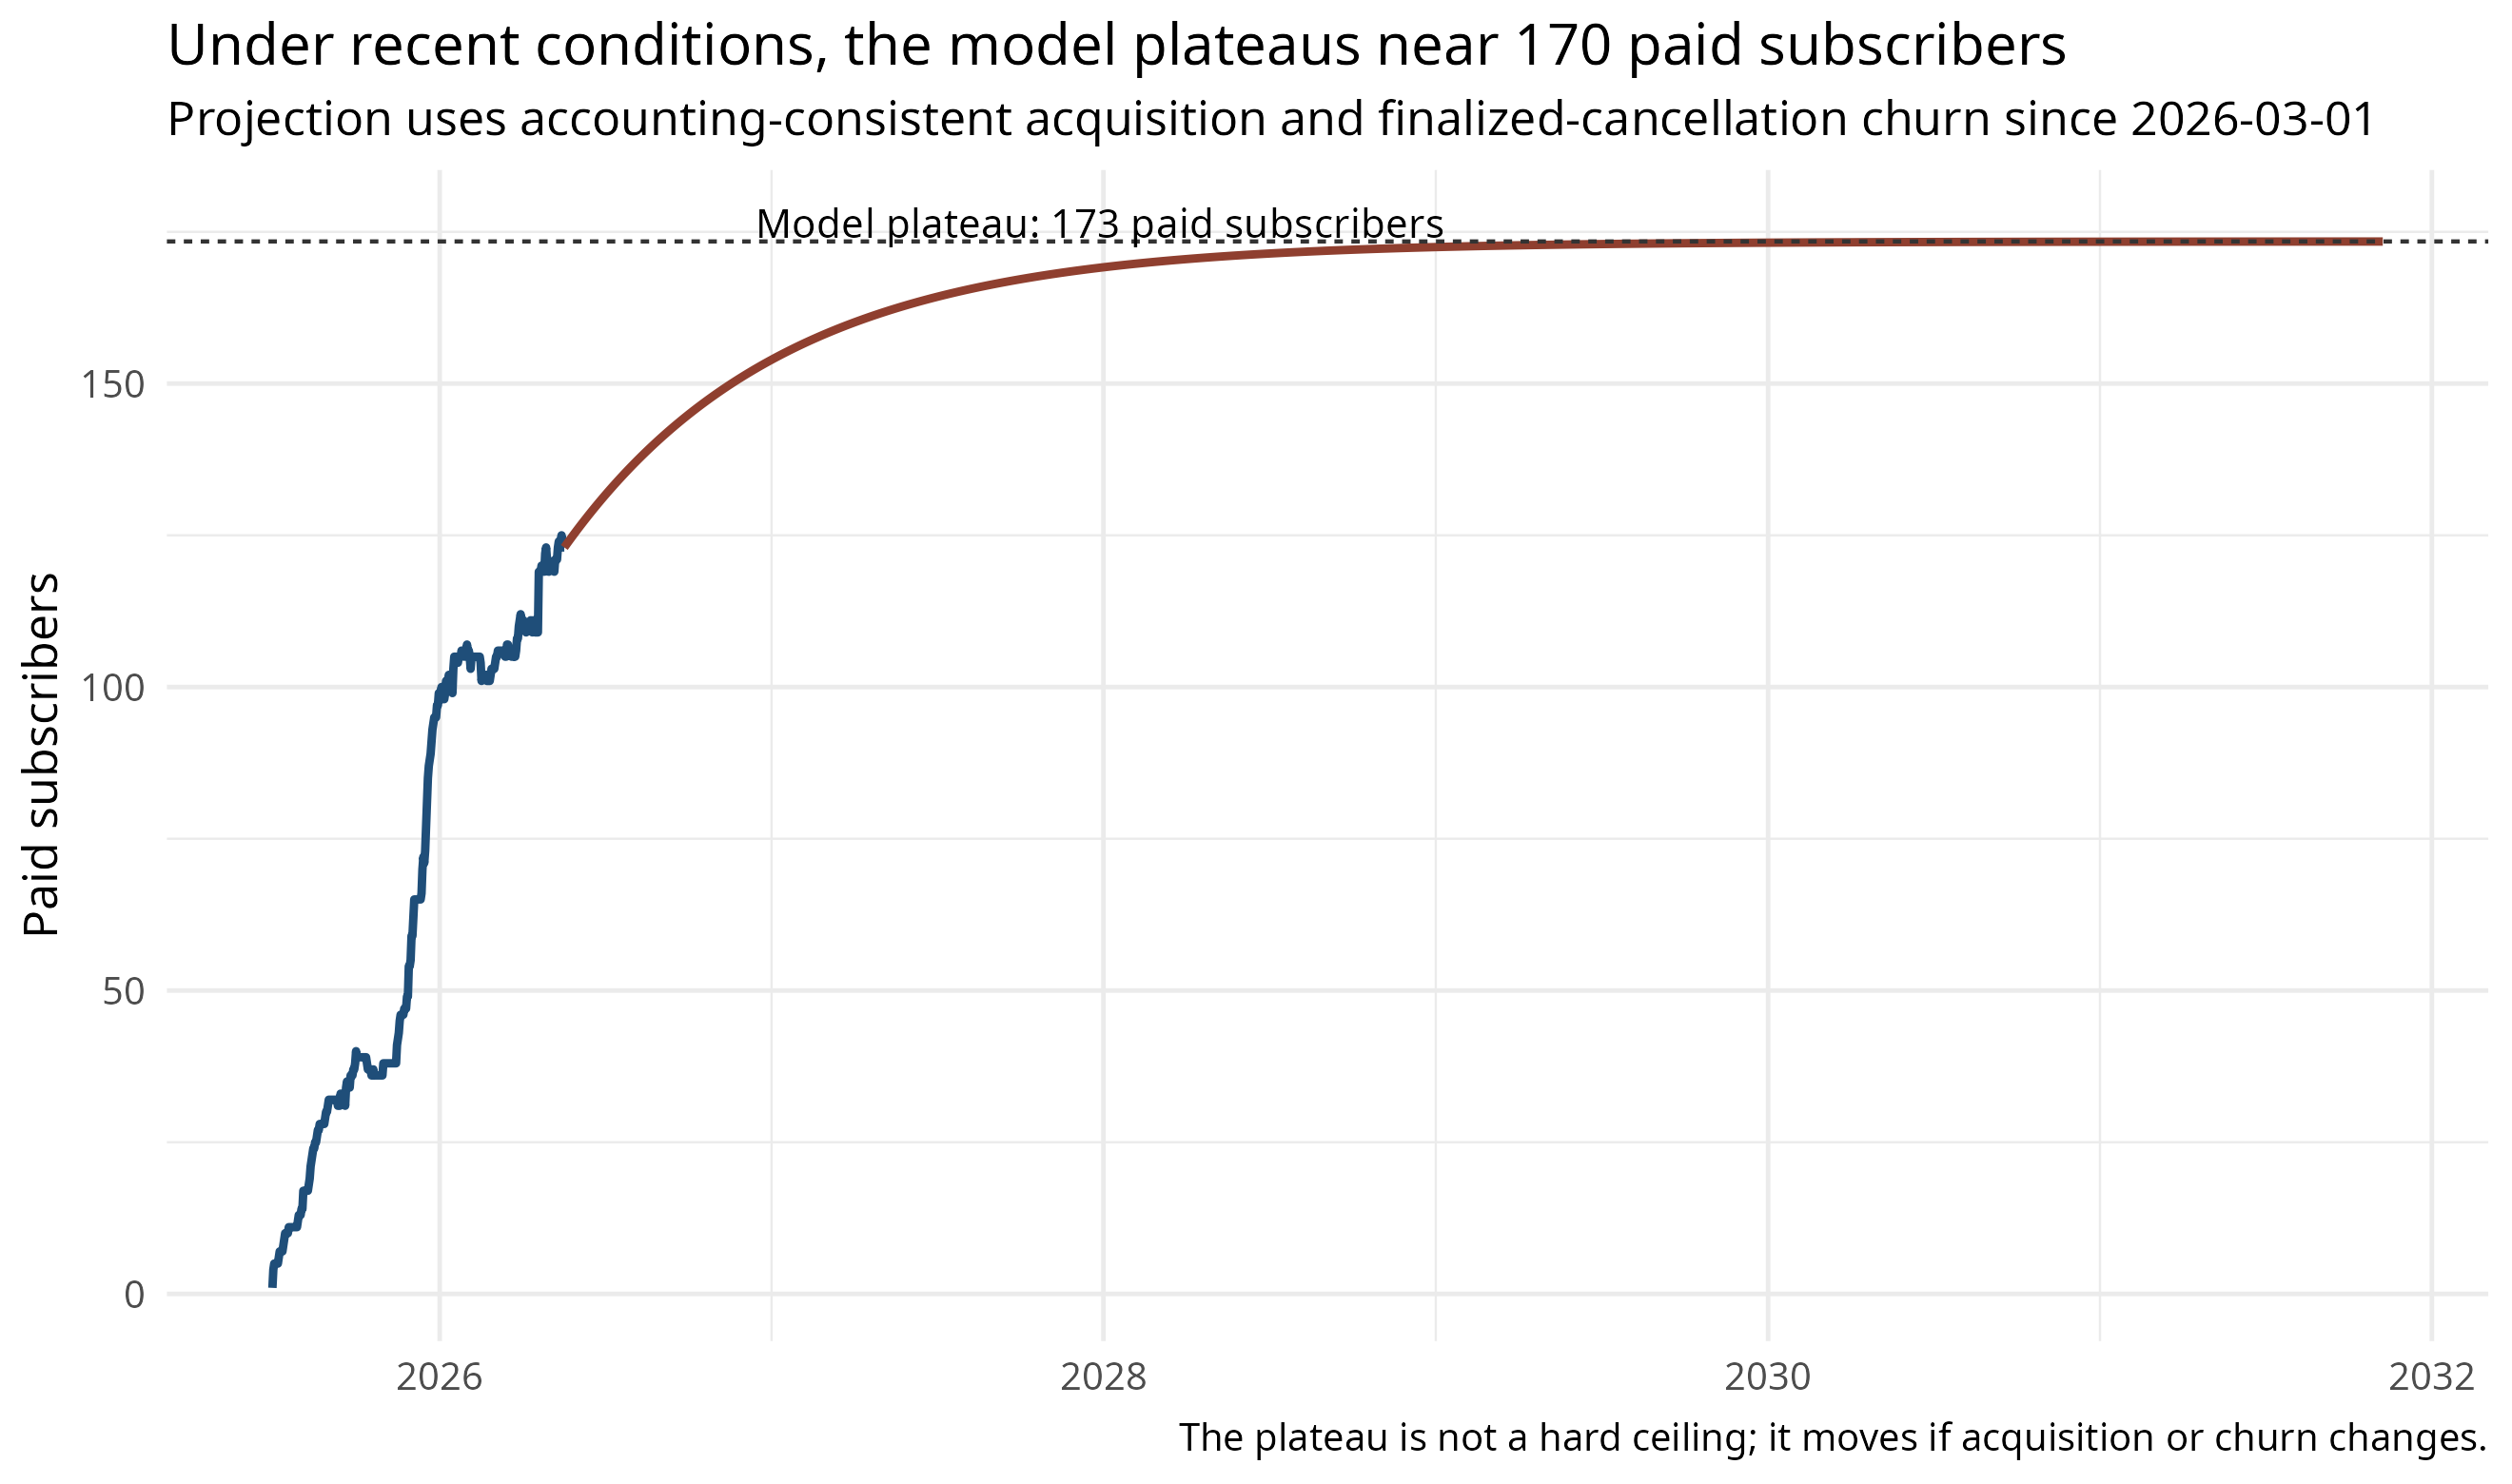
If recent acquisition and finalized-cancellation rates hold steady, the paid subscriber list is projected to plateau around 173 paid subscribers. Given a current count of 123, the publication has roughly 50 more paid subscribers to gain before net growth grinds to a near-halt.
Note: This estimate is a baseline, not a prophecy. Depending on the data window analyzed, the plateau estimate fluctuates between 171 and 176. While the precise number moves, the core conclusion does not: under recent conditions, the curve bends.
This slowing growth is not due to an audience ceiling or Substack limitations. It is basic subscription arithmetic: if daily acquisitions (x) remain flat while total cancellations scale naturally with a larger subscriber base, net growth must slow down.
Figure 1. Paid subscribers rose quickly, but the curve is already bending
The Mathematical Model
The model is deliberately simple: tomorrow’s paid subscribers equal today’s paid subscribers, plus new paid subscribers, minus churn.
N[t+1] = N[t] + x - cN[t]
Here N is the active paid subscriber count, x is the average number of paid acquisitions per day, and c is the daily cancellation rate per active paid subscriber. When x equals cN, growth stops. The implied plateau is N* = x/c.
Data Definitions: Acquisition vs. Churn
Churn: Measured by finalized cancellations (when a subscriber is officially removed from the paid count) rather than cancellation initiations (intent to cancel).
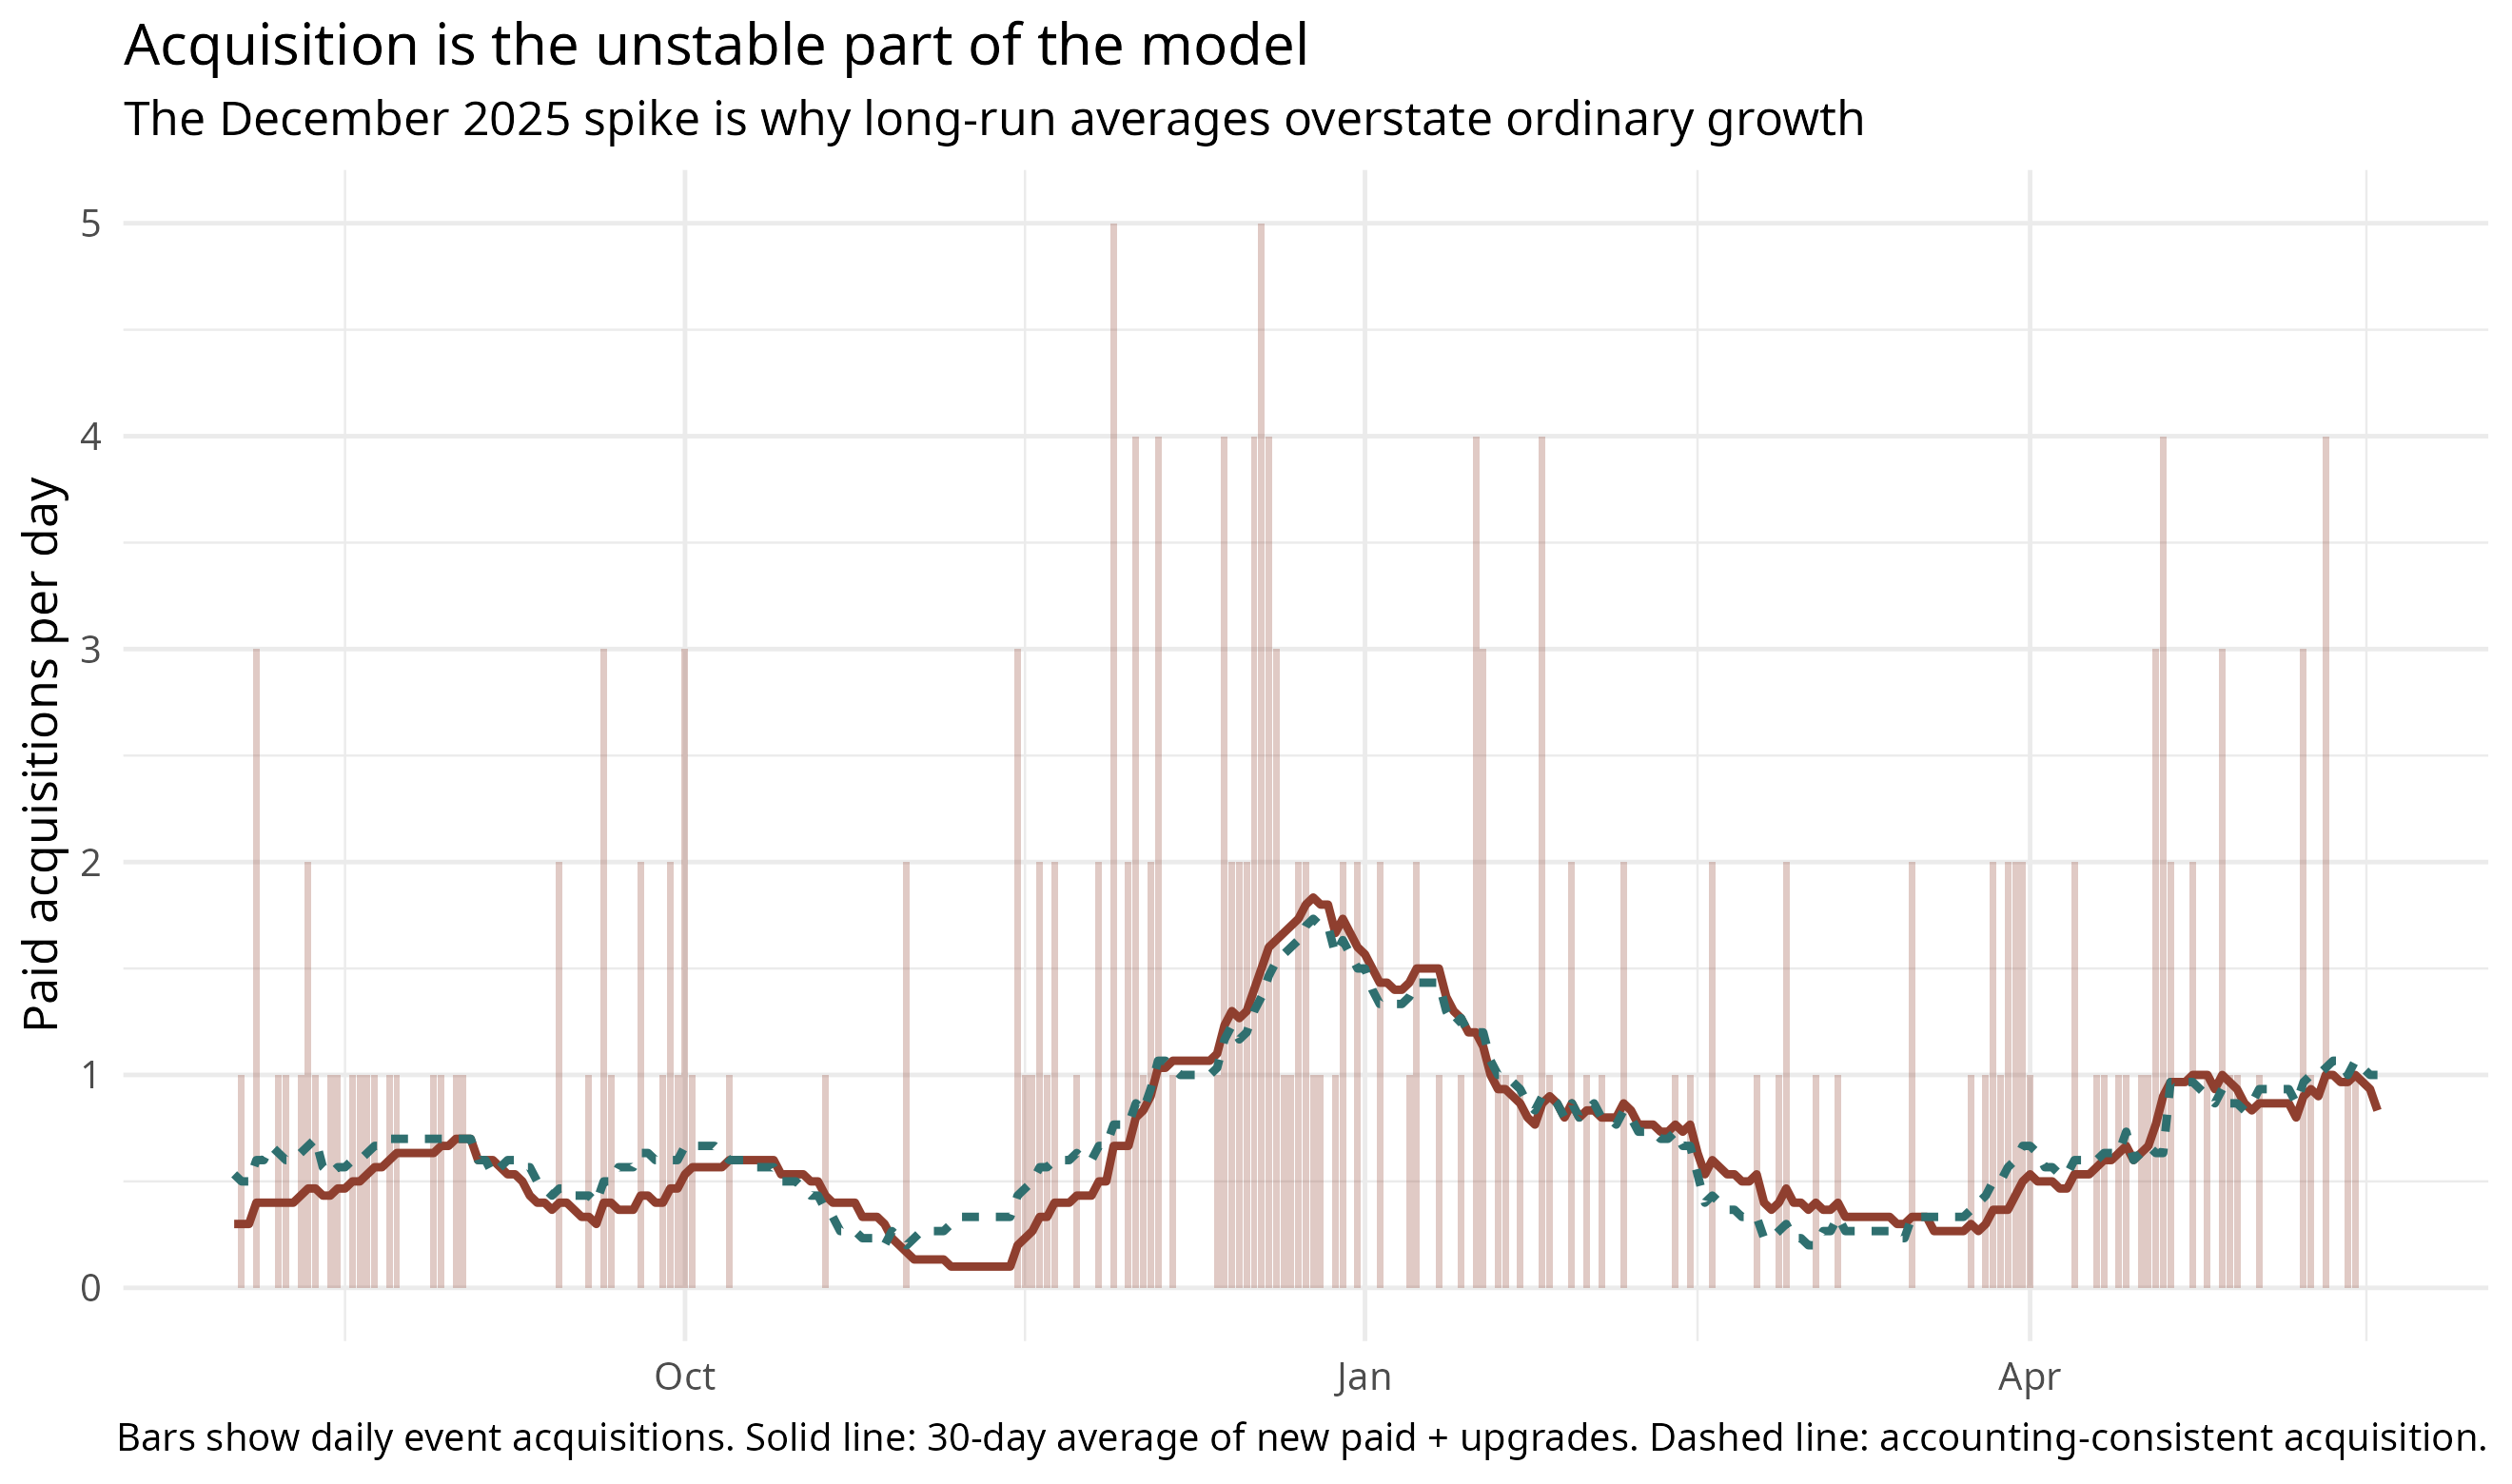
Acquisition: Analyzed through two lenses:
Visible Event Count: New paid sign-ups plus tier upgrades.
Accounting-Consistent Acquisition: The net change in paid subscribers plus finalized cancellations. This version better matches the actual paid-count series, accounting for minor ledger inconsistencies in the event export.
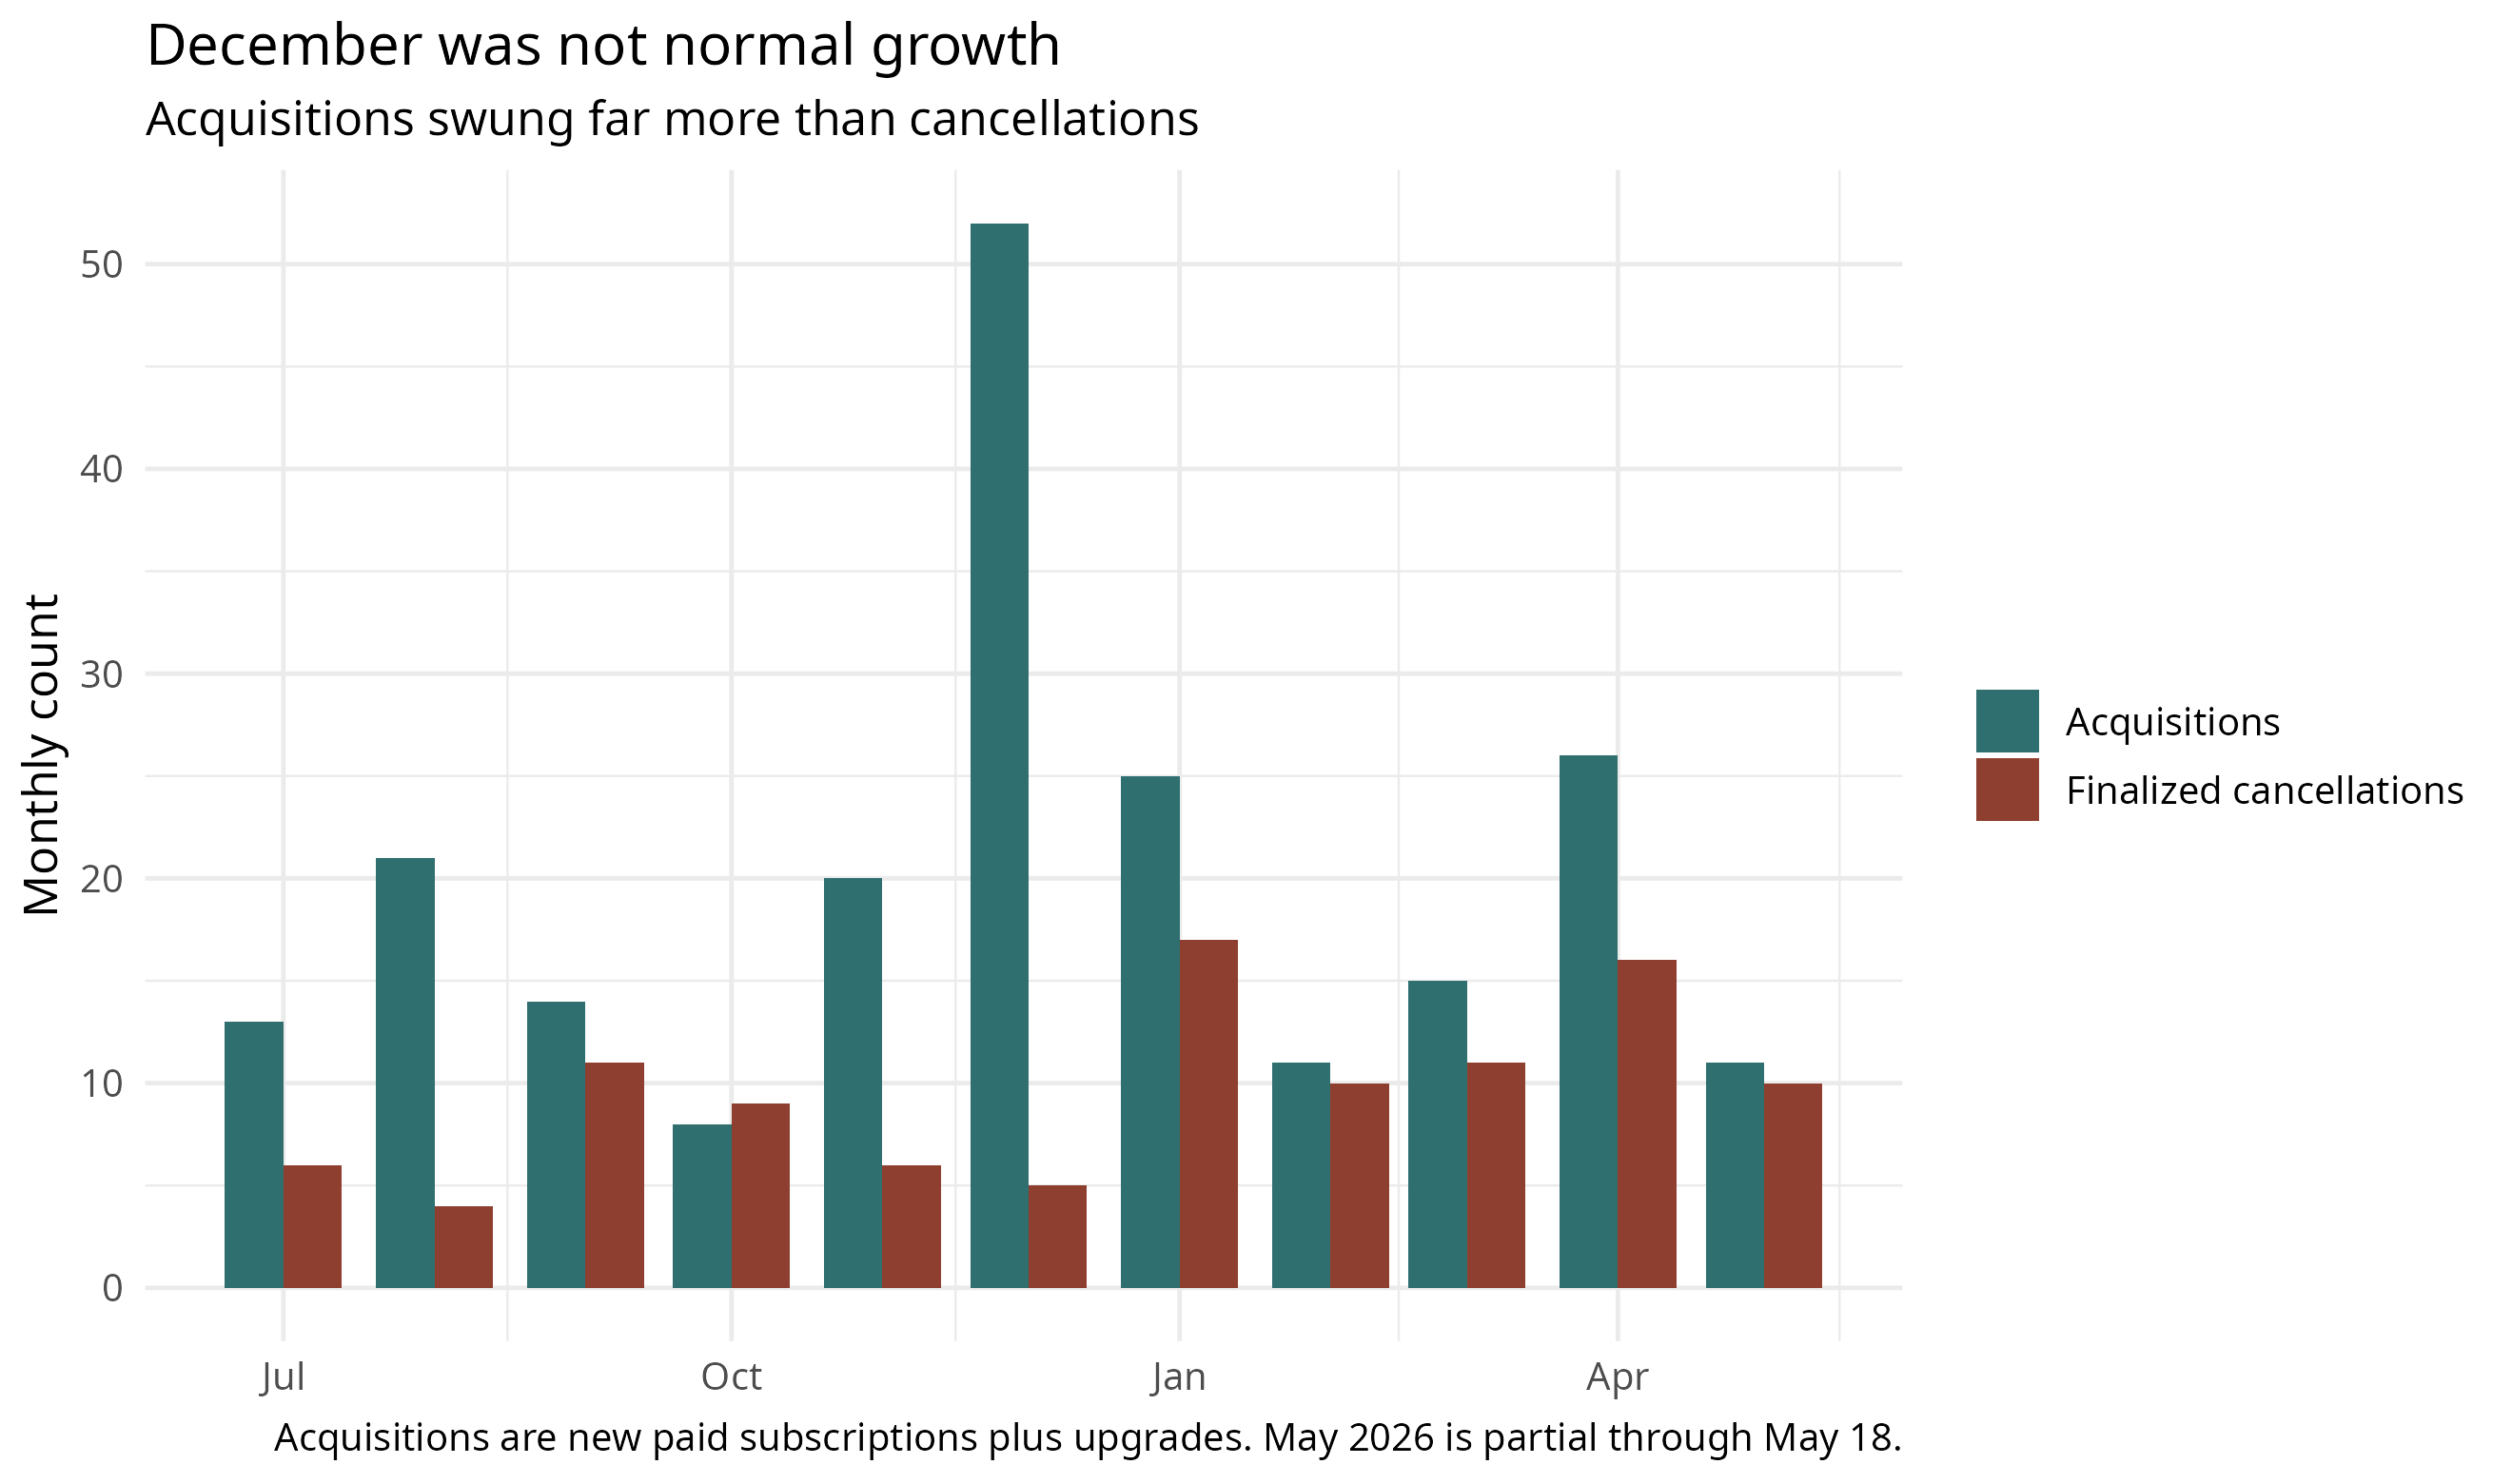
Figure 2. Acquisition is the unstable part of the model
Has churn stayed stable?
The simple model assumes a stable per-subscriber churn rate. If I use the whole history, that assumption looks too strong: a formal test rejects one constant churn rate over the whole observed period. But the publication started on July 1, 2025, and the first few months are a cold-start period. When the paid base is tiny, one or two cancellations can produce a huge apparent churn-rate swing.
Excluding July through September changes the result. From October 1, 2025 onward, the estimated daily churn rate is 0.42%. Adding a time trend to daily churn gives p = 0.61; the weekly version gives p = 0.868; and monthly churn differences give p = 0.311. In other words, after the launch period there is not strong evidence that churn kept trending up or down.
Recent daily churn estimates also cluster around 0.38% to 0.46% of the active paid base per day. In plain English, that is about 3.3 finalized cancellations per week in the recent March-to-May window.
I tested this more formally with Poisson churn models that treat cancellations as proportional to paid-subscriber exposure. Adding a linear time trend to daily churn gives p = 0.0025. The weekly version gives p = 0.00261. Monthly churn differences give p = 0.00613. Those full-history p-values are evidence against a single stable churn rate across the entire history, mostly because they include the launch period.
So the model should be read as a post-launch/recent-conditions model, not as a universal law. After the first three months, the stable-churn approximation looks much more defensible. The bigger practical uncertainty is still acquisition: x moves around a lot.
Figure 3. Recent churn has hovered around 0.4% per day
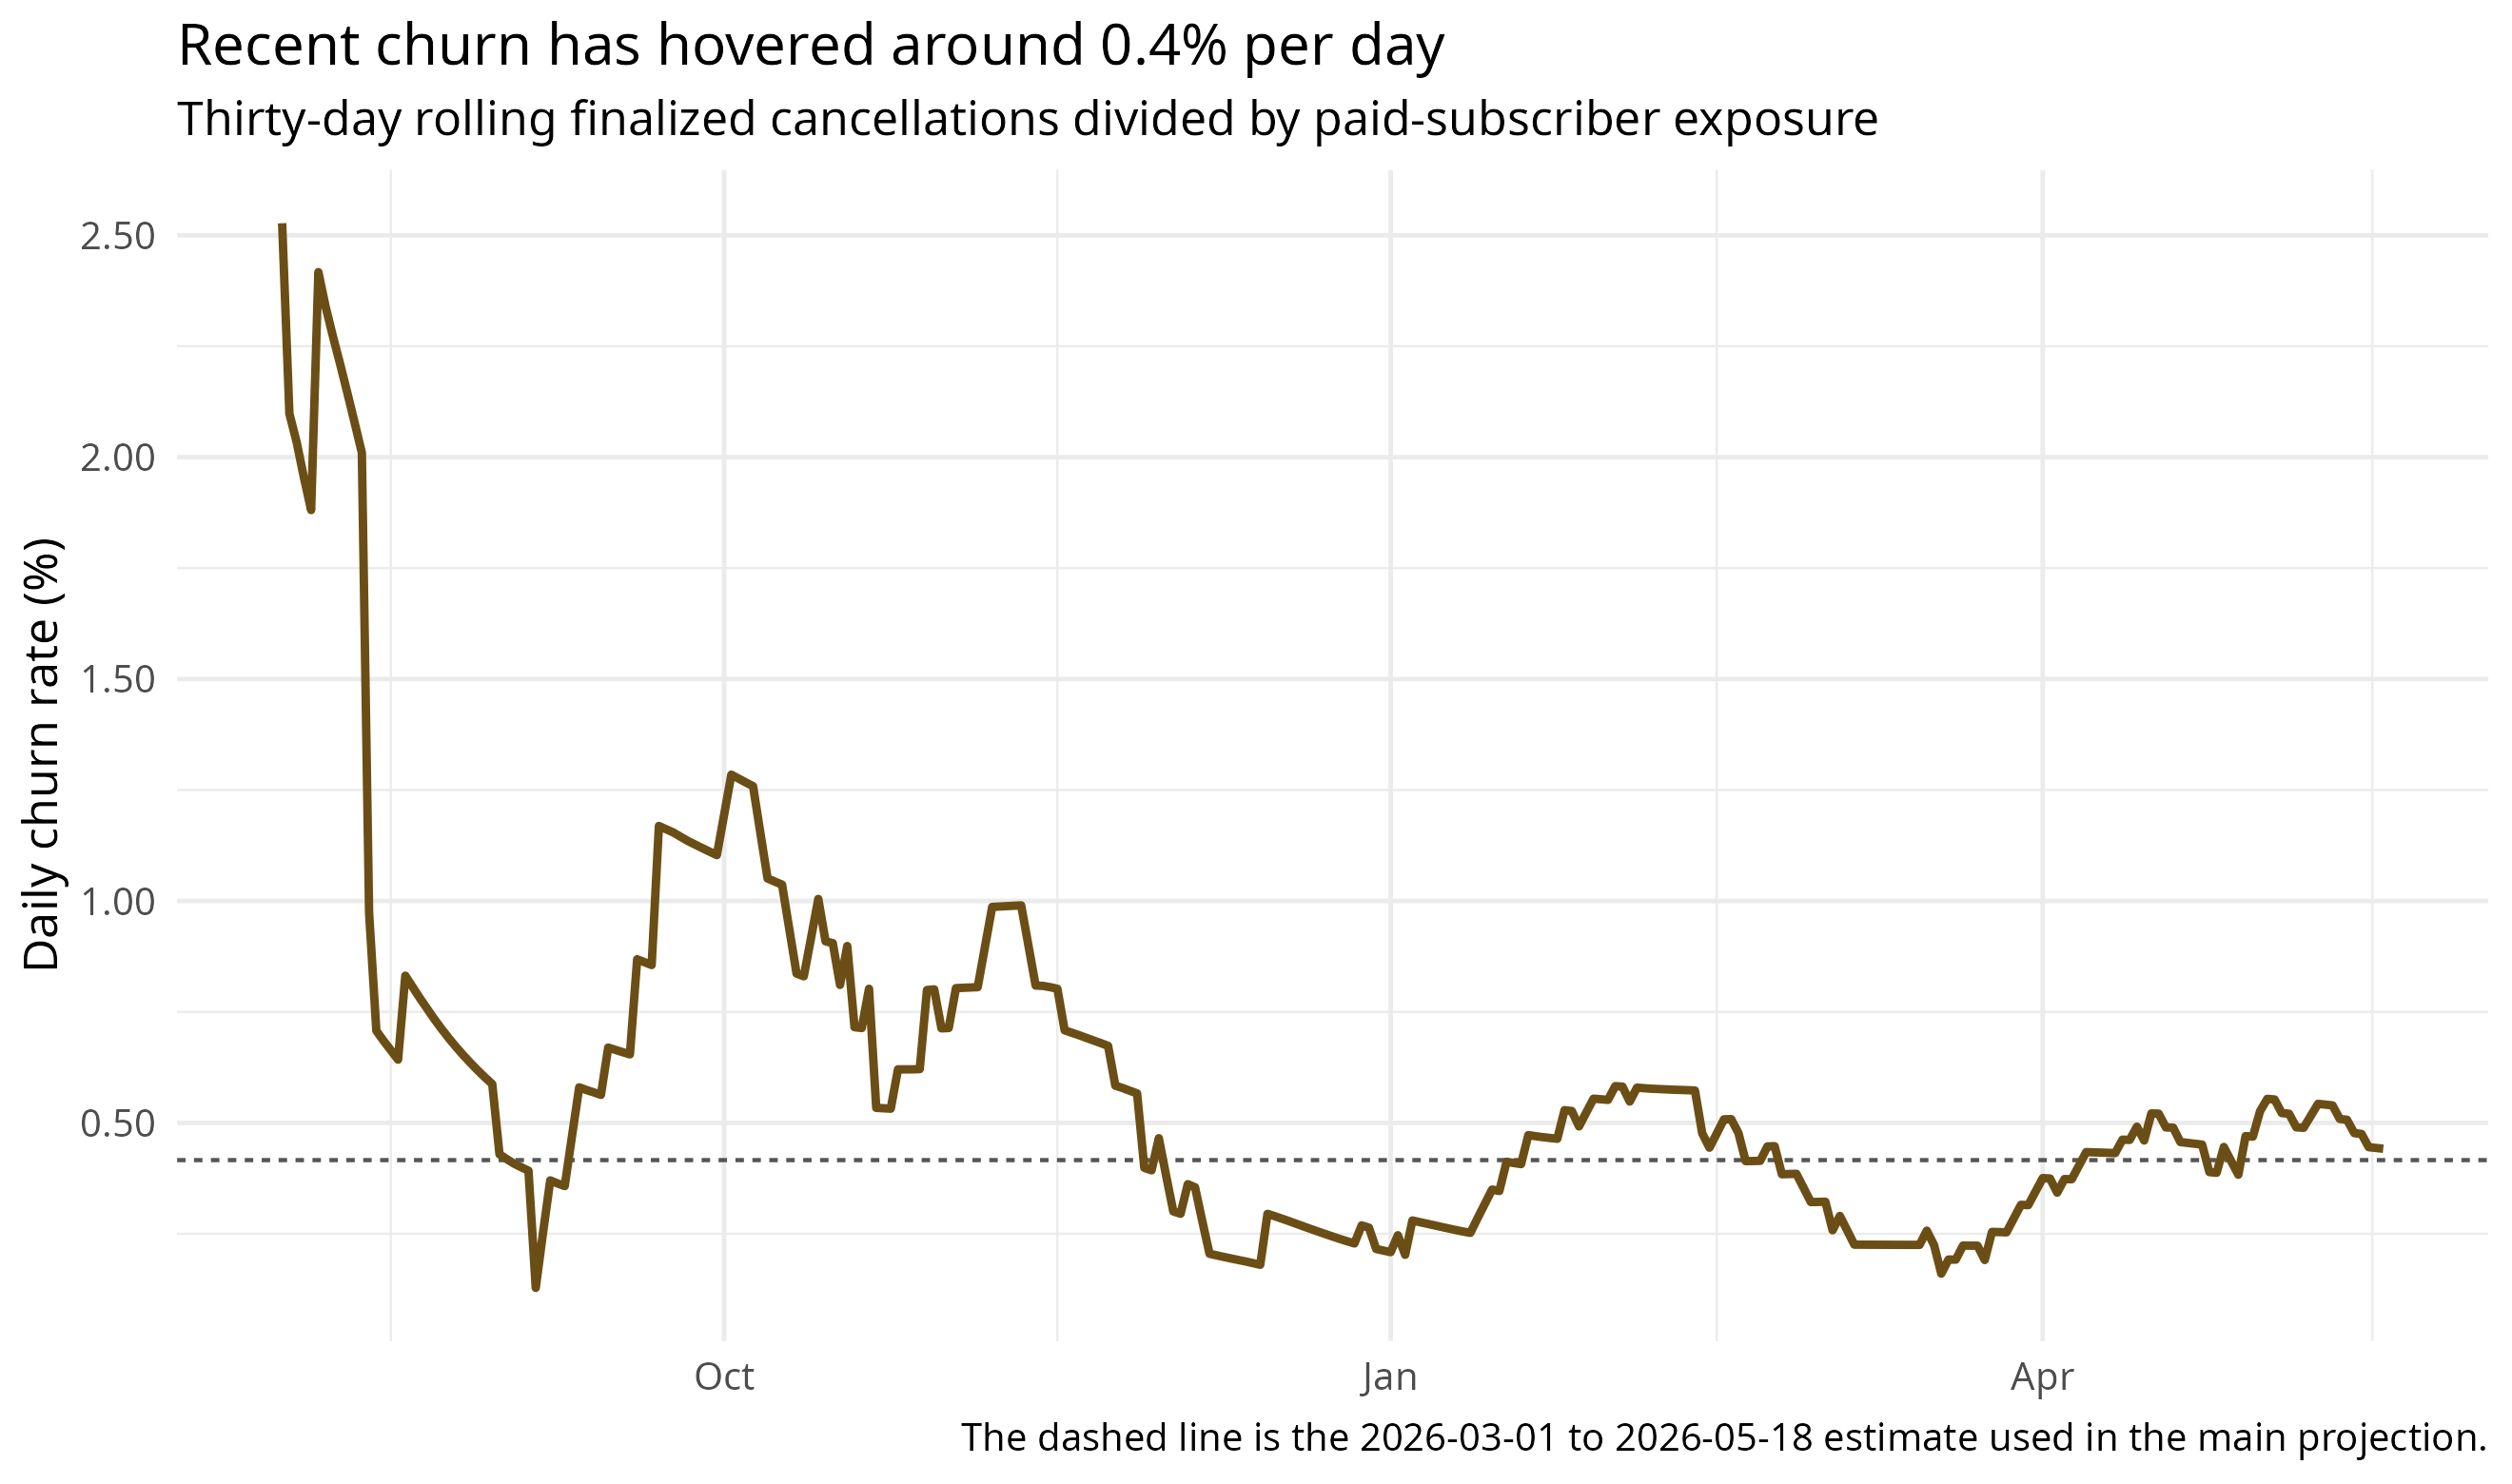
Figure 4. Weekly losses are roughly proportional to the paid base
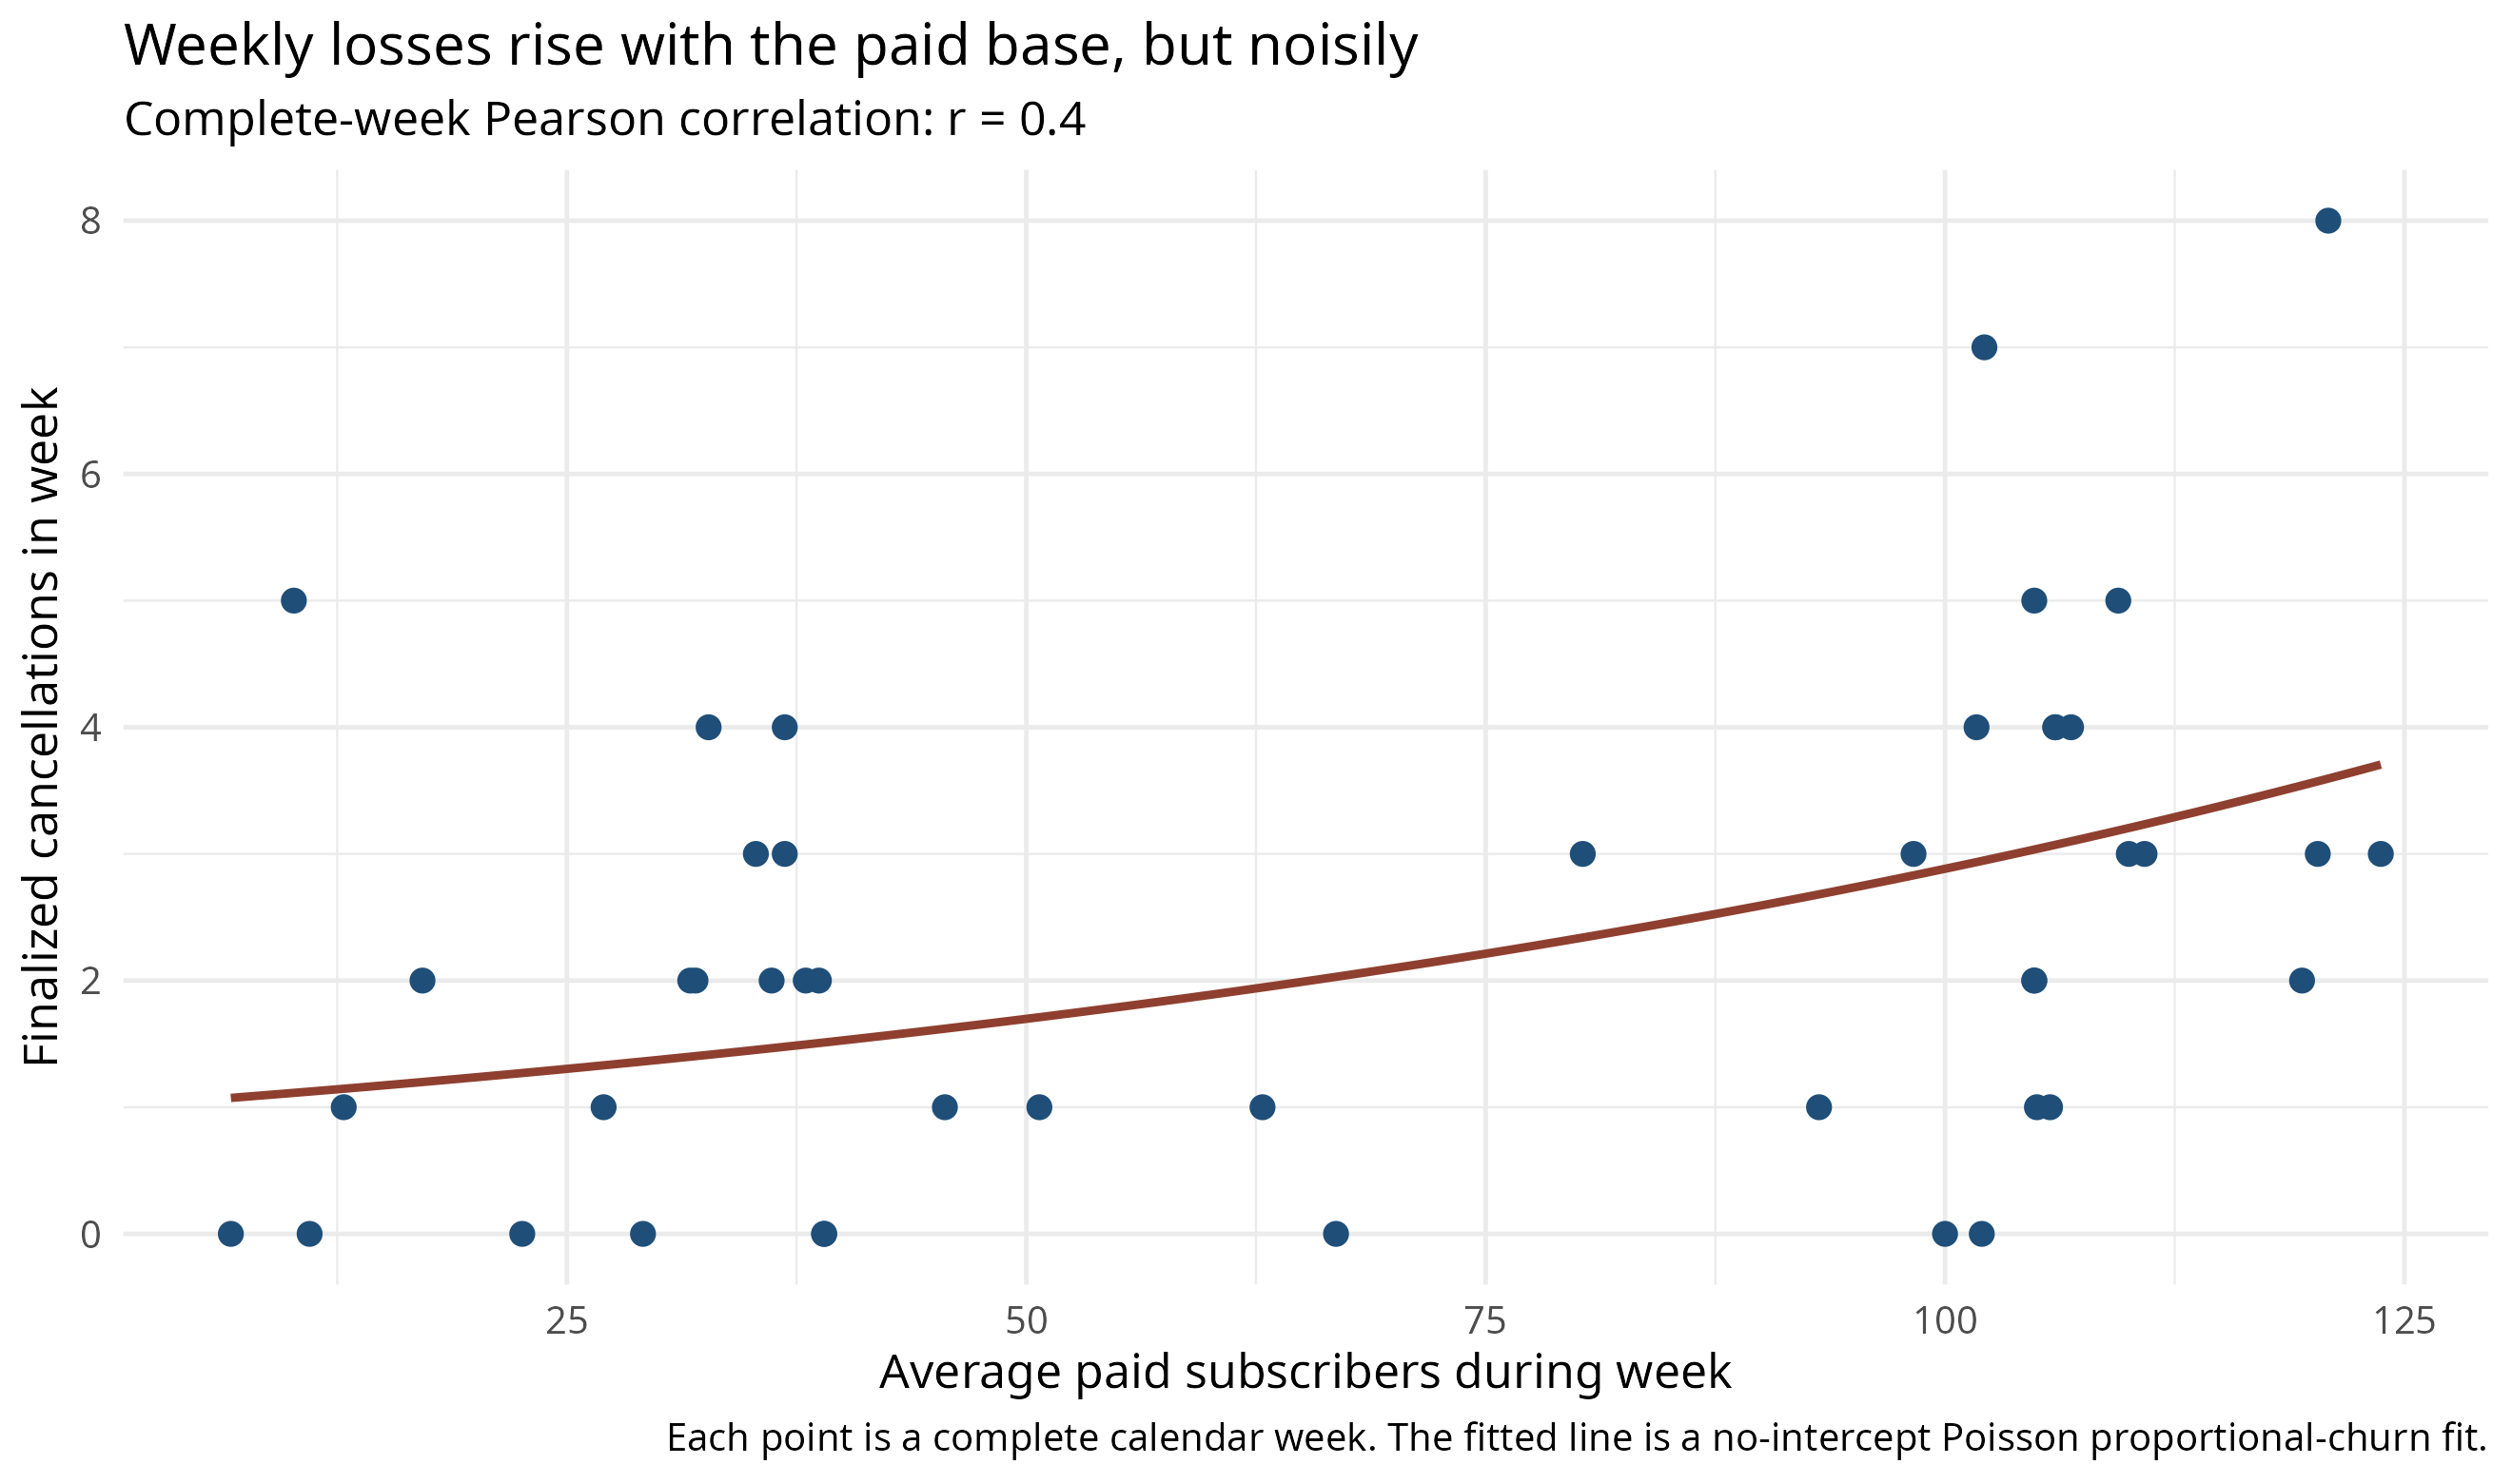
The plateau estimate
Using the March 1 to May 18 period, the accounting-consistent acquisition rate is 0.722 subscribers per day and daily churn is 0.416%. That gives N* = x/c = 173.4. Rounded, the model says about 173 paid subscribers.
The approach to a plateau is gradual. Under this model, I reach 90 percent of the remaining distance to the plateau around November 22, 2027, 95 percent around May 06, 2028, and 99 percent around May 27, 2029. That last date should not be read too literally; it mostly illustrates that plateaus are asymptotic.
Figure 5. Under recent conditions, the model plateaus near 170 paid subscribers
Window sensitivity
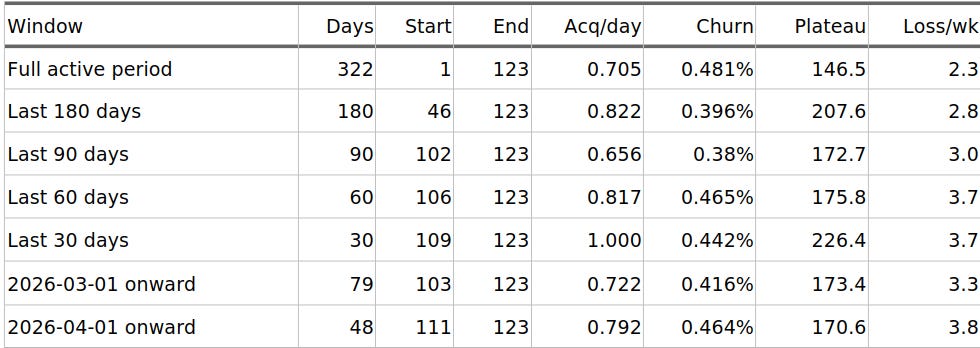
Figure 6. December was not normal growth
What would change the answer?
Left unchanged, the current growth engine has a visible structural ceiling. To push past 170 subscribers, the publication needs either a higher steady-state acquisition rate or lower churn.
Which means, of course, that there is a remarkably simple way for you to help me test (and completely break) this model in real time: subscribe. If enough of you convert to paid, the acquisition rate spikes, the formula resets, and this entire forecast becomes delightfully, beautifully wrong. You know, for science.
Methods note
The paid subscriber count comes from the daily Substack subscriber export through May 18, 2026. I use Paid only, excluding comps, gifts, and free trials. The growth-event file does not perfectly reconcile with the paid-count file, so the Fortunately, there is a remarkably simple way to test—and break—this model in real-time: subscribe. If enough readers convert to paid, the acquisition rate rises, the formula resets, and this entire forecast becomes safely obsolete.paid-count series is treated as ground truth and finalized cancellations are treated as the best observed loss series.