
Can Genes Help Countries Get Rich?
A genetic test of one of the oldest questions in economics

For most of modern economic history, explanations have focused on institutions, geography, culture, and historical contingency. Some countries developed more capable states, some were better positioned for trade, some accumulated technical knowledge earlier, and some experienced wars or political shocks that permanently changed their paths. Those explanations remain central.
There is also a narrower possibility that economists rarely put into cross-country growth models: populations may differ slightly, on average, in inherited traits related to learning and human-capital accumulation. That does not mean genes determine the destiny of countries. Development depends on policy, health, migration, institutions, incentives, conflict, and chance. The question is whether education-linked genetic differences contribute any predictive information once some of that history is taken into account.
I tested that question in 38 countries with genetic estimates and comparable economic data from 1970 to 2019.
Why growth is a harder test than wealth
The genetic evidence begins with a genome-wide association study, usually shortened to GWAS. A GWAS scans genetic variants in a large sample and asks whether each variant is statistically associated with a trait. Here the trait is educational attainment—roughly, years of schooling completed. Each individual association is tiny, uncertain, and not usefully interpreted on its own.
A polygenic score, or PGS, combines many of those small estimated associations into one index. For each sampled population, I multiplied the education-GWAS weight at each variant by its estimated frequency and added the results. A PGS is a statistical predictor, not an education gene, a measure of human value, or a fixed forecast of anyone’s life. Its meaning is especially indirect when it is averaged across population samples and assigned to a country.
I used two published scores. EA3 comes from the 2018 study led by James Lee, which analyzed about 1.1 million people. EA4 is the 2022 successor led by Aysu Okbay, based on roughly 3 million people and including within-family analyses. I standardized EA3 and EA4 across the final country sample, averaged them equally, and standardized the average again. Equal weighting is simple and transparent. It also avoids pretending that the two studies are independent replications, because some participants and much of the underlying genetic signal overlap.
The outcome is not how rich a country is today. It is average annual growth in real GDP per person between 1970 and 2019: the change in log GDP per person, divided by 49 years and expressed as a percentage. In ordinary language, this measures how quickly each country’s average income rose over the period.
The first look at the data
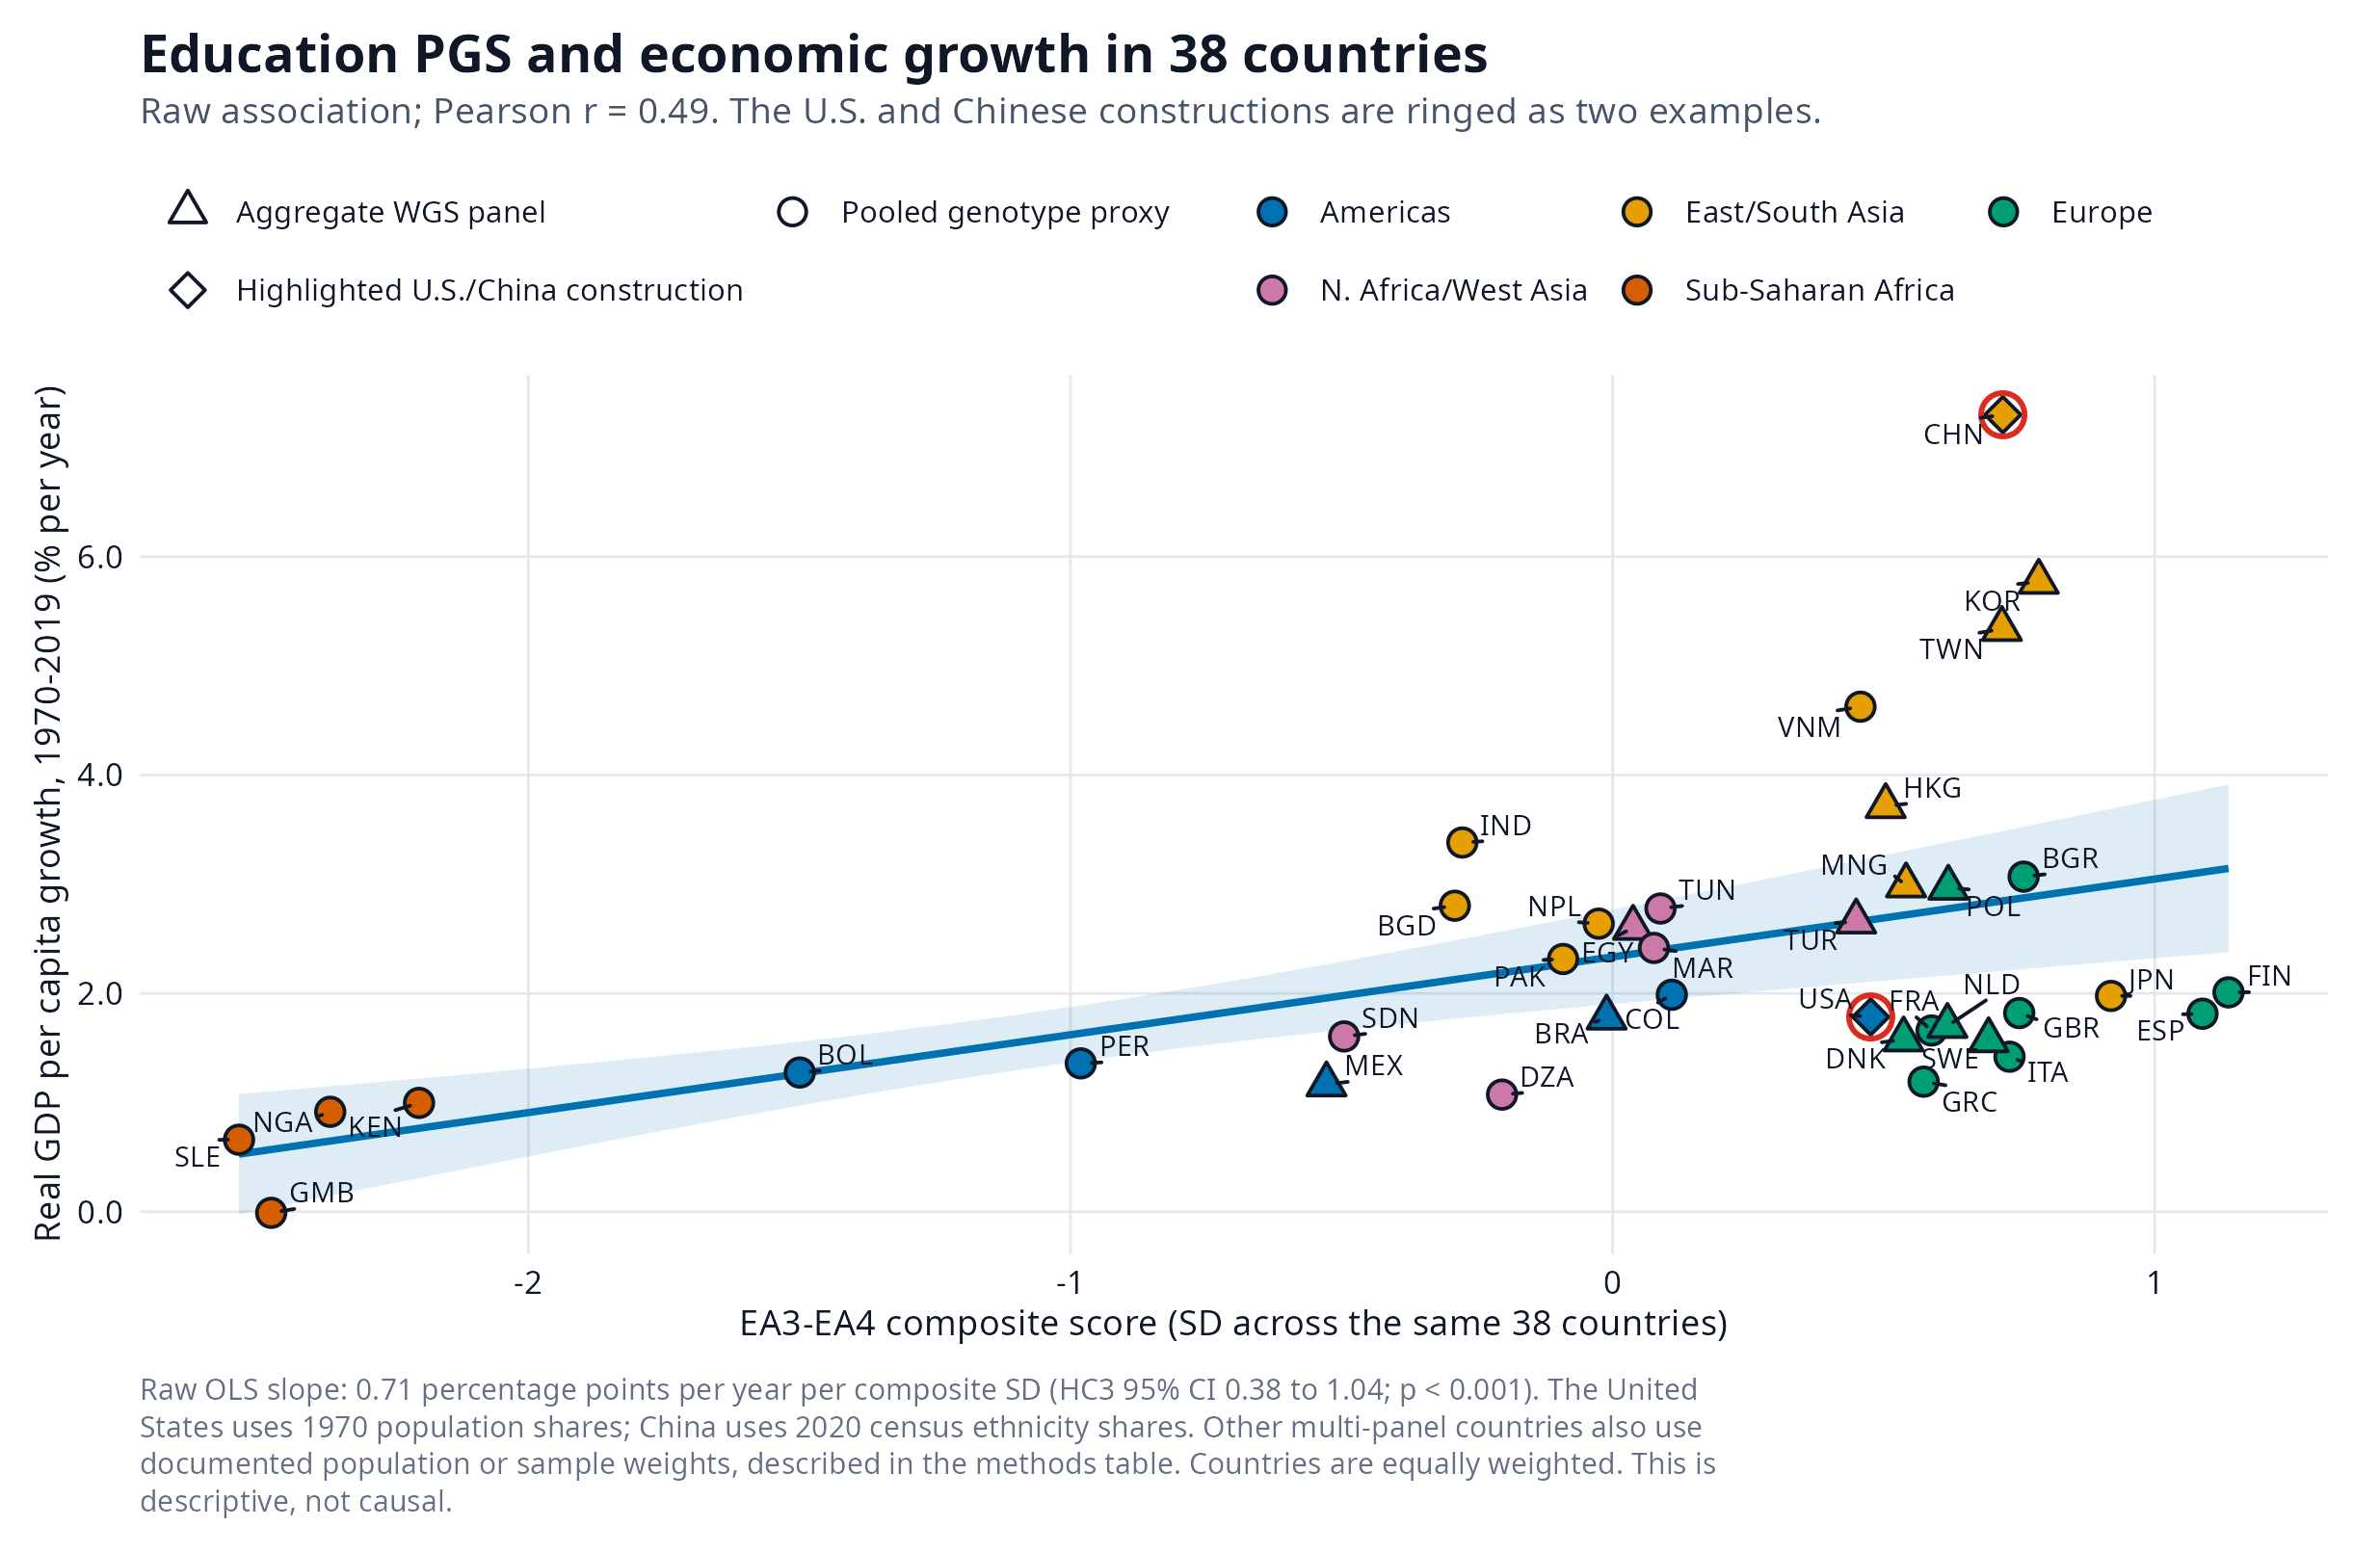
The unadjusted pattern is positive. Across the 38 countries, the Pearson correlation between the composite score and annual real-GDP-per-person growth is 0.49. In a simple regression, a one-standard-deviation higher score is associated with 0.71 percentage points faster annual growth. The 95% uncertainty interval runs from 0.38 to 1.04 percentage points. Figure 1 shows the individual countries behind that line.
Figure 1. Raw education-PGS composite and 1970–2019 annual growth in real GDP per person across 38 countries.
Accounting for where countries started
The raw relationship is not the most informative test. Countries did not start 1970 at the same level of development. Poorer countries can often grow quickly by adopting machinery, knowledge, and organizational practices already used elsewhere. Economists call this convergence. Rich countries usually have less room for that kind of easy catch-up.
I therefore control for GDP per person in 1970. The comparison becomes: among countries beginning at roughly similar income levels, did the country with the higher education-linked score subsequently grow faster?