
Did Brain Size Decline After the Upper Paleolithic?

Since at least the mid-20th century, when anthropologists such as Weidenreich (1946) noted that some Pleistocene crania exceed modern averages, researchers have debated whether average brain size declined after the Upper Paleolithic.
Some cranial datasets seem consistent with a decline. Late Pleistocene Europeans are often reported to have larger endocranial volumes than recent populations. But other analyses dispute the magnitude, the direction, or even the existence of this pattern. The underlying data are fragile: samples are small, preservation is uneven, and survivorship bias is plausible (large, thick crania are more likely to survive than small or fragile ones). Methods also vary across laboratories, and the geographic composition of samples shifts across periods. Under these conditions, apparent trends can reflect sampling and reconstruction differences rather than evolutionary change.
I reviewed this controversy in a previous essay, Reconsidering Human Brain Evolution. In a more rigorous reanalysis of the main published datasets, Villmoare and Grabowski (2022) found that the apparent recent decline largely disappears once temporal and geographic lumping (and the sampling biases it induces) are addressed, because these practices systematically depress estimates of modern brain size. A further issue is that cranial capacity, much like stature, is not a purely genetic trait: it is meaningfully shaped by early-life environment and nutrition, which complicates any attempt to infer long-run evolutionary trends directly from skeletal measurements.
There is also another problem, which some would argue gives rise to a paradox.
Over roughly the same time span, polygenic scores associated with cognitive performance and educational attainment rise strongly in ancient DNA. Using modern GWAS weights, the average increase from Upper Paleolithic individuals to recent Europeans is on the order of two standard deviations. You can argue about portability, LD decay, stratification, and all the usual caveats, but the direction of change is remarkably consistent across datasets and methods.
And brain size, however imperfectly, is positively correlated with intelligence.
So, if genetic propensity for cognitive ability went up, why wouldn’t brain volume or cortical surface area also tend to rise, at least on average, everything else being equal?
One obvious answer is that maybe they did but our osteological data are too noisy to see it clearly.
This pushed me toward a different strategy.
Instead of asking what the bones look like, we can ask what the genomes predict.
Recent GWAS allow us to compute polygenic scores for traits related to brain morphology, such as cortical surface area (CSA) and brain volume (BV). These are not perfect measurements of phenotype, but they are consistent, standardized, and available for thousands of ancient individuals. They bypass preservation bias. They scale. And they let us test whether the genetic architecture underlying brain structure moved in the same direction as cognitive PGS.
If Upper Paleolithic people truly had larger brains despite lower scores for cognitive ability, that is interesting.
If instead the genetic predictors of brain size also increase through time, then the apparent decline in skeletal estimates may be misleading.
So what happens when we track CSA and BV PGS from 45,000 years ago to the present?
Brain volume and cortical surface move together
Before looking at time or climate, it is useful to check something basic: do the genetic predictors of brain morphology behave the way neuroanatomy would lead us to expect?
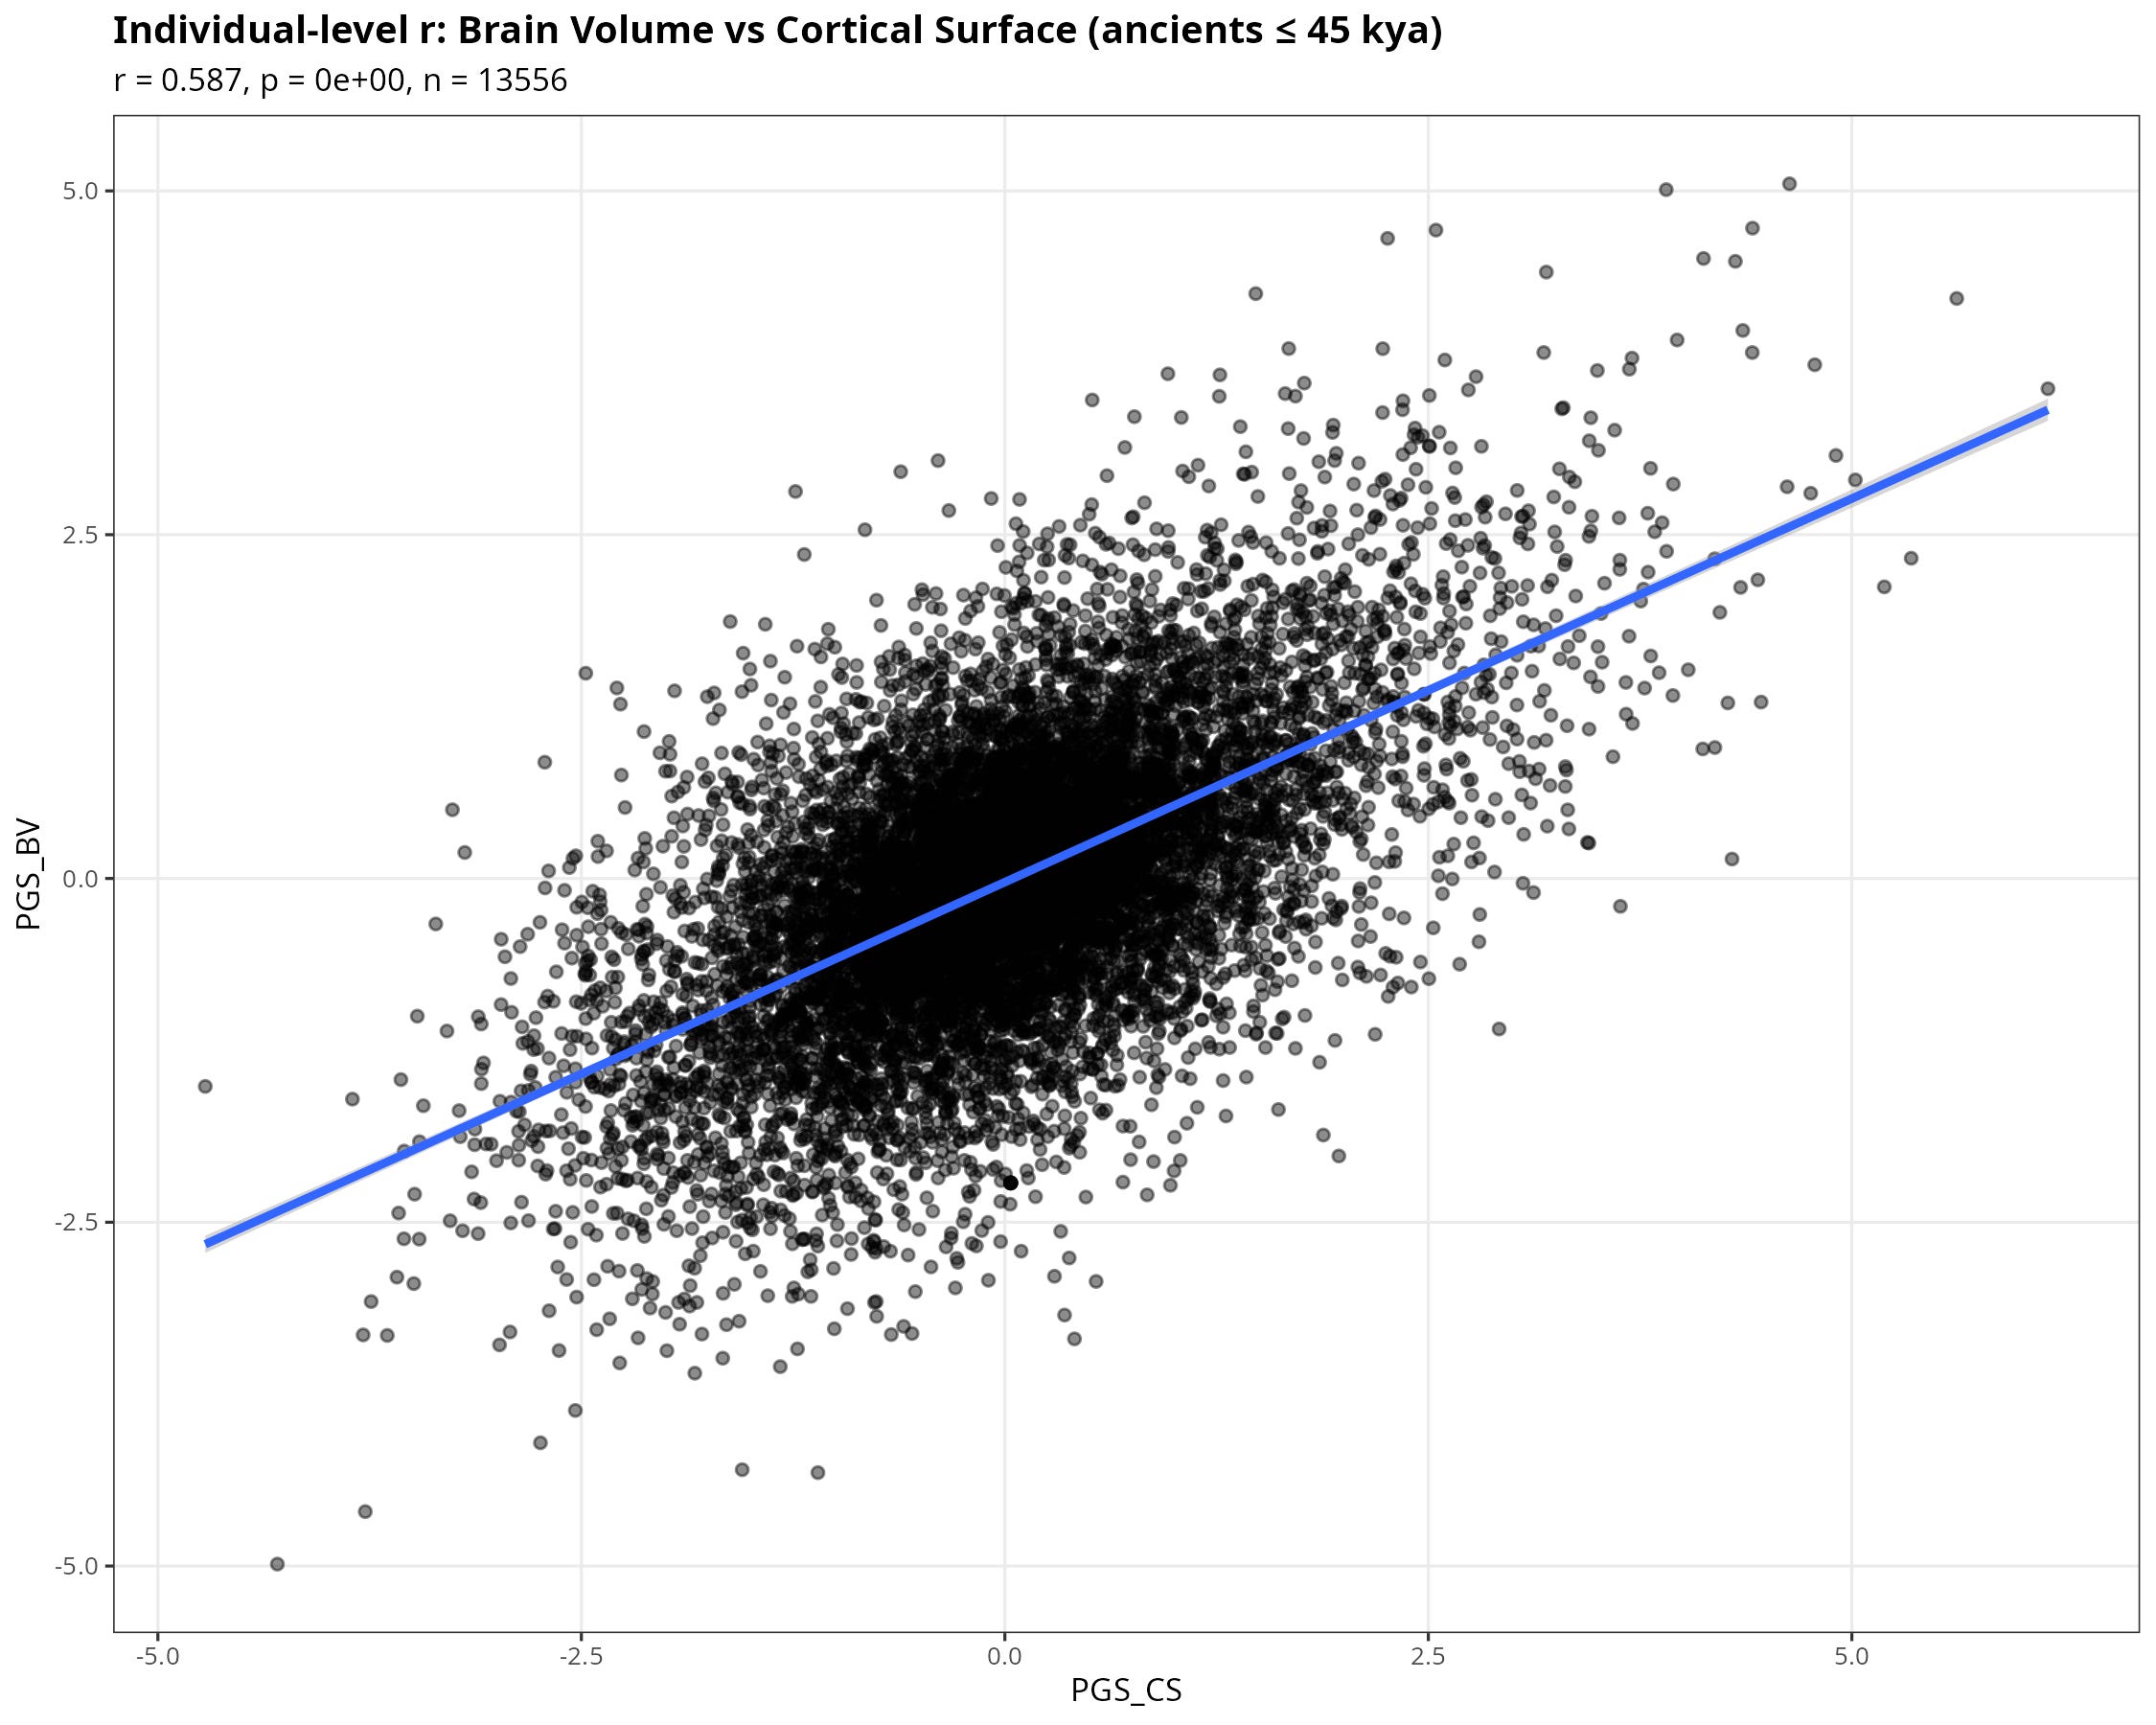
They do. Across individuals in the AADR sample (≤ 45,000 BP), the polygenic scores for brain volume (BV) and cortical surface area (CS) are strongly positively correlated (r ≈ 0.59). With more than thirteen thousand individuals, the p-value is effectively zero.
Whatever noise, LD decay, or portability issues exist, the scores are not behaving randomly. They capture a shared biological signal. Bigger brains in volume tend also to be bigger in surface.
If we had found no relationship here, the rest of the exercise would be suspect.
Climatic selection
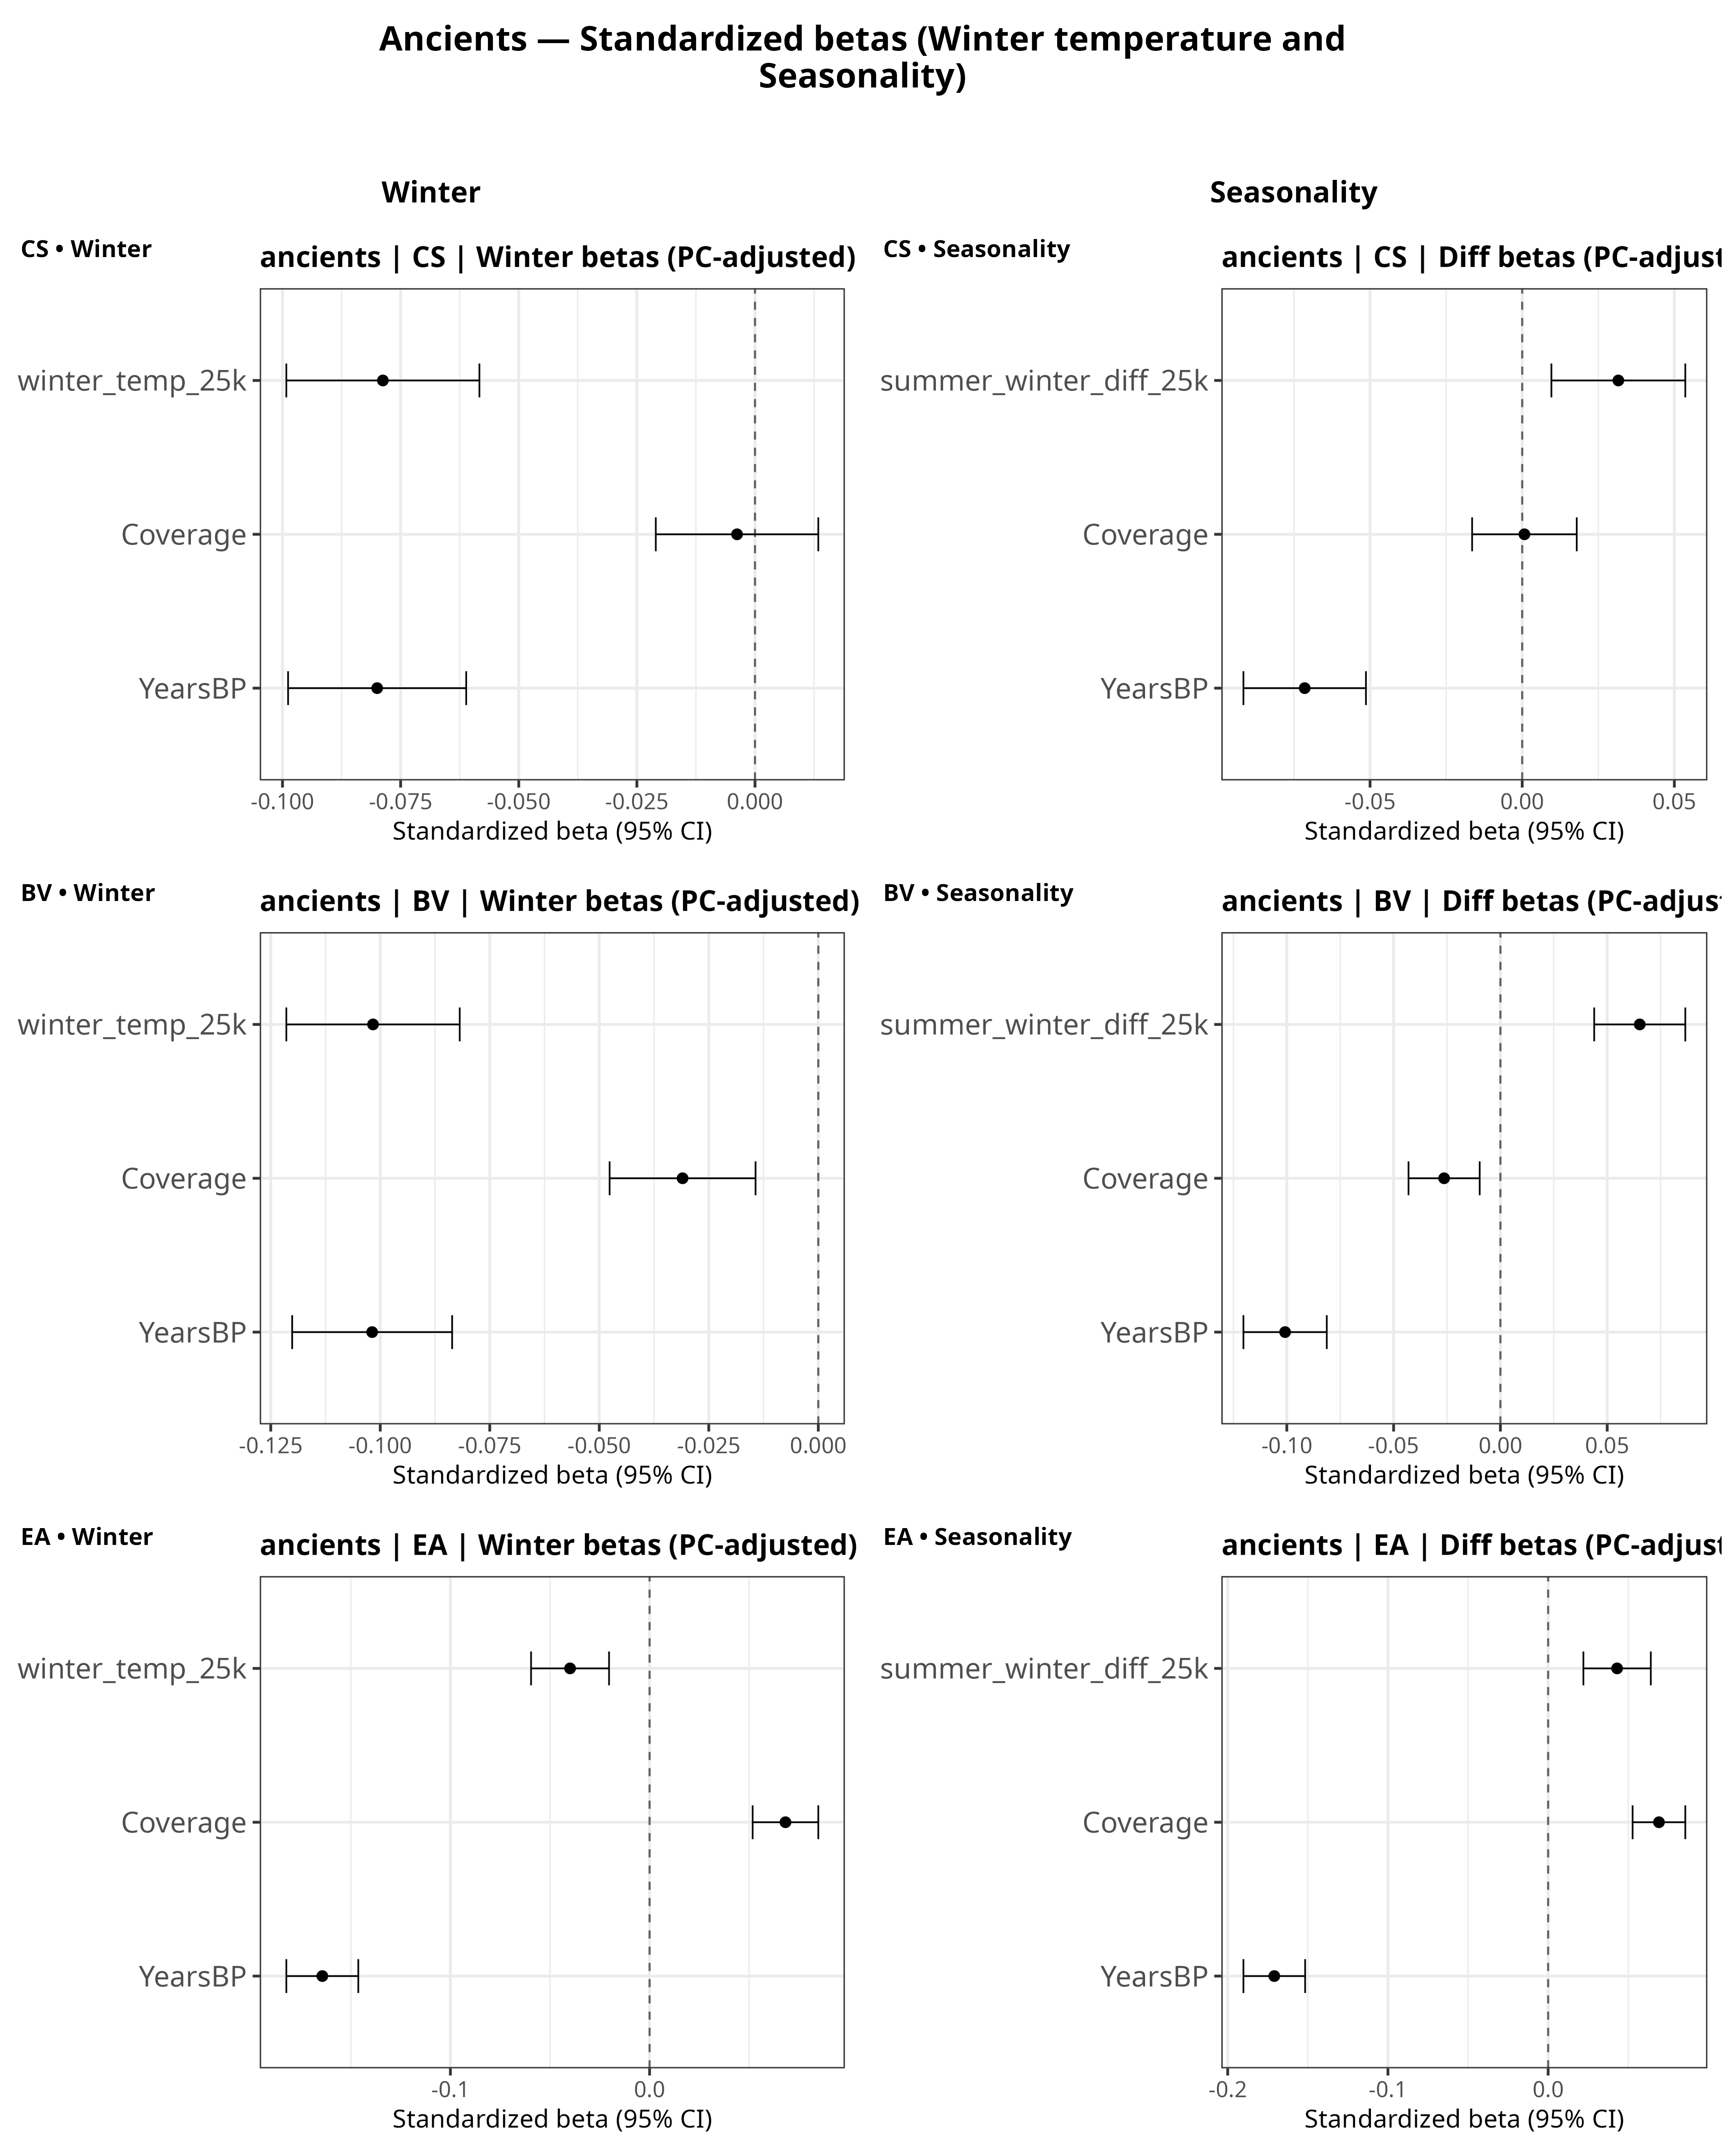
I estimated regressions of the form:
PGS ~ winter temperature + seasonality + Years BP + Coverage + 6 ancestry PCs.
(The six PCs are included to absorb population structure; they’re not shown in the coefficient plots.)
Two patterns are consistent across CSA and BV.
First, the coefficient on winter temperature is negative. Because the predictor is temperature, this means that warmer winters predict lower CSA/BV PGS, and conversely colder winters predict higher CSA/BV PGS, holding ancestry, time, and coverage constant.
Second, seasonality (the summer–winter difference) is positively associated with both traits in these models.
Meanwhile, the coefficient on Years BP is generally negative. Since the x-axis runs from past → present, this indicates that, conditional on ancestry, the PGS tend to be higher in more recent individuals.
The time trend after removing ancestry and coverage
To visualize the temporal signal more directly, I residualized CS and BV on coverage and the six PCs, then plotted those residuals against Years BP.
🔒 The remainder of this post (effect sizes, robustness checks, and implications) is for subscribers.