
Did Climate Change Make Humans Shorter or Taller?

There is an old model in evolutionary biology known as Bergmann’s Rule: warm-blooded animals living in colder environments tend to evolve larger body sizes to minimize their surface-area-to-volume ratio, thereby conserving metabolic heat.
When applied to human population history, this framework generates a straightforward prediction: populations in colder regions should carry a higher density of height-increasing alleles. If you look at a static modern genetic map, you’ll see that higher height polygenic scores (PGS) heavily cluster in colder northern latitudes, seemingly validating the model.
But this static observation is deeply flawed because it conflates two entirely different tests:
The Geographic Correlation: Are colder places, on average, cross-sectionally associated with higher polygenic scores for height?
The Historical Dynamics: When a specific location experiences a temporal shift in temperature, do subsequent generations in that exact place undergo a parallel genetic shift in height?
Relying on the geographic cross-section is highly problematic. Because human groups migrate, a static map cannot determine whether a genetic pattern is a direct adaptation to local climate or simply a reflection of old population structure and ancestral movements.
To run a direct, unconfounded test, we need a kind of natural experiment. In a true experiment, an experimenter manipulates an independent variable to observe its isolated effect on a dependent variable. In paleogenomics, we obviously cannot manipulate the climate of the past. However, by looking within the exact same location over time, we can let history run its own natural experiment. When a specific region experiences a sudden cooling or warming episode while its physical geography remains entirely constant, we can observe the direct effect of that climate “manipulation” on the subsequent gene pool.
To execute this, I reran an ancient-DNA climate model using a statistical framework that explicitly decouples stable differences between regions from these historical climate shifts occurring within those exact same regions.
The signal isn’t merely that cold places have higher allele scores. Rather, a 1,000-year local temperature drop adds predictive information that geographic variance alone cannot account for.
Controlling for Population Structure
The primary vulnerability of simpler climate-genetic models is that they risk merely rediscovering geography. Northern and eastern ancient populations differ genetically from southern ones due to deep ancestral population structure, and they happen to have lived in colder climates. If a model links baseline cold to height PGS without accounting for this, it is likely tracking old migrations rather than localized climate response.
To set a more rigorous baseline, I isolated the temporal component by asking: Given the average long-run temperature of a specific location, does the localized change in temperature over the previous 1,000 years add any predictive value?
Using data from ancient individuals in the Allen Ancient DNA Resource (AADR v66) matched with paleoclimate reconstructions from CHELSA-TraCE21k, I calculated a localized historical lag:
Delta1000 = Current Window Temperature - Temperature 1,000 Years Prior
Negative values indicate local cooling over the preceding millennium.
Positive values indicate local warming.
Figure 1. Local 1,000-Year Temperature Change Across Ancient Sample Locations
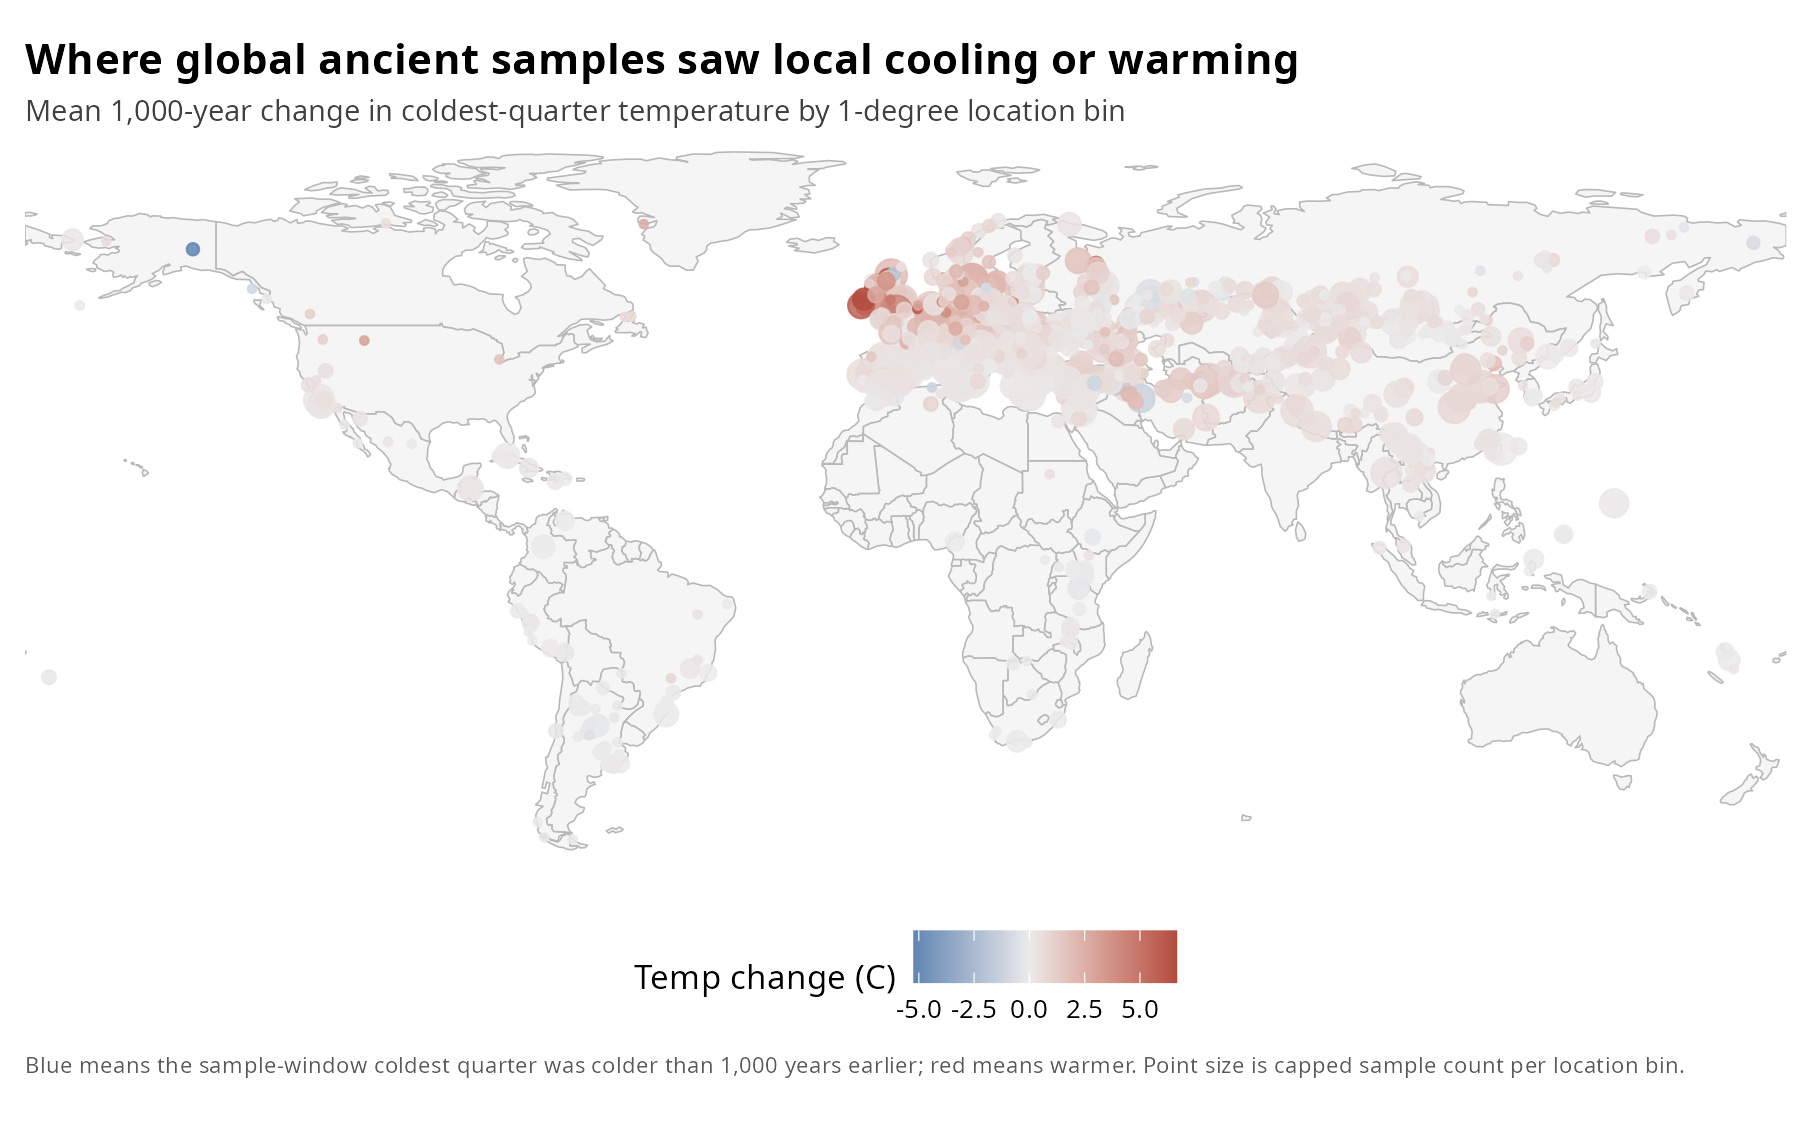
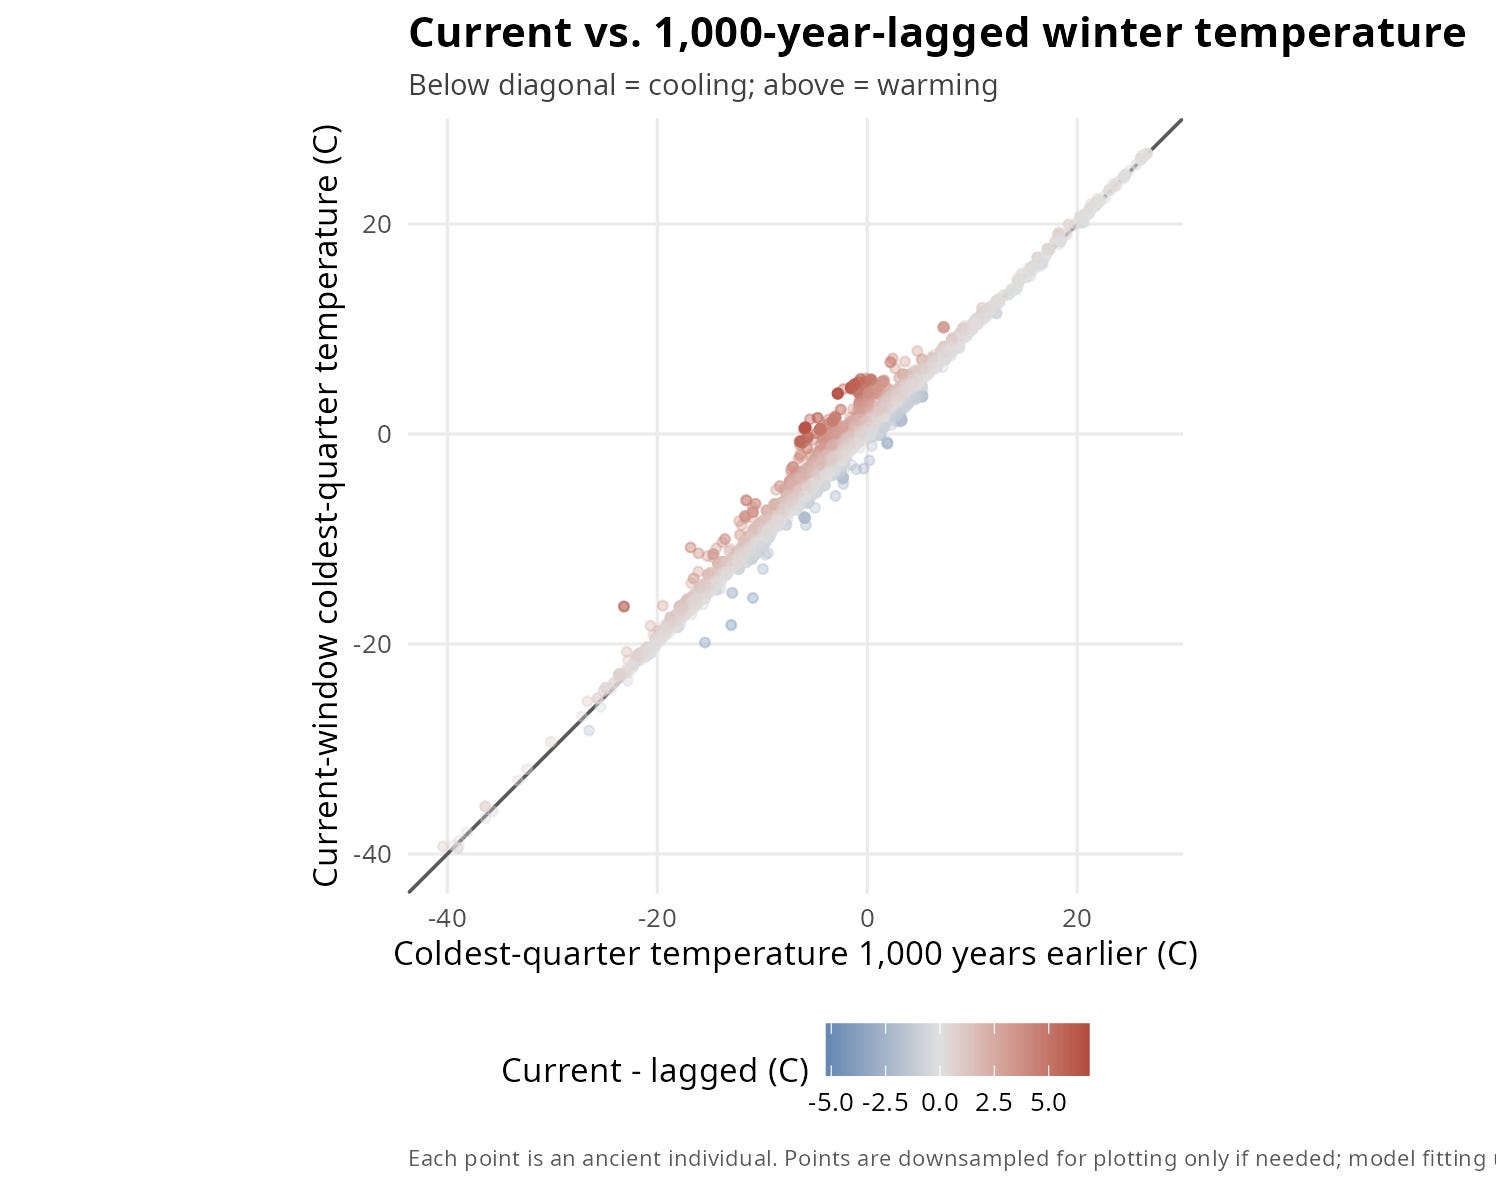
While a map shows us where these climate shifts occurred, it doesn't give us a clear sense of the raw data's balance. To see exactly how many individual samples lived through historical anomalies versus stable baselines, we can strip away the map coordinates and plot each individual's current-window winter temperature directly against its own 1,000-year historical lag.
Figure 2. Current vs. 1,000-Year-Lagged Winter Temperature
To prevent spatial population structure from driving the results, I utilized a Mundlak specification (a correlated-random-effects approach). This framework formally decomposes the climate variables into two distinct components:
The between-location component: Captures whether a location is generally colder or warmer than other regions globally (susceptible to migration confounding).
The within-location component: Captures whether a specific sample’s local climate was colder or warmer than that exact location’s own long-run historical baseline (the direct test).
Note on the genetic metric: This analysis tracks the frequency of modern GWAS height-associated alleles moving through ancient genomes. It measures shifts in weighted polygenic scores, not direct osteological measurements.
What the Data Says
When you force the model to look strictly at historical temperature change within a location rather than the latitude of the sample, the model’s predictive power improves significantly.
Table 1. Does 1,000-Year Temperature Change Add Predictive Value?
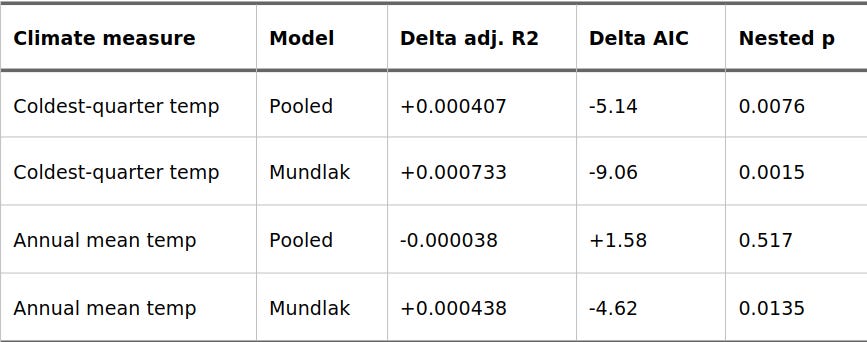
The key metric here is Delta adj. R2, which shows whether adding the 1,000-year temperature change improves the model after baseline temperature, geography, and ancestry controls are already factored in.
The cleanest, most robust result comes from winter temperatures (coldest-quarter). Adding the previous millennium’s temperature trend significantly improves the Mundlak model (p = 0.0015).
Figure 3. Local Temperature Change and Ancient Height PGS
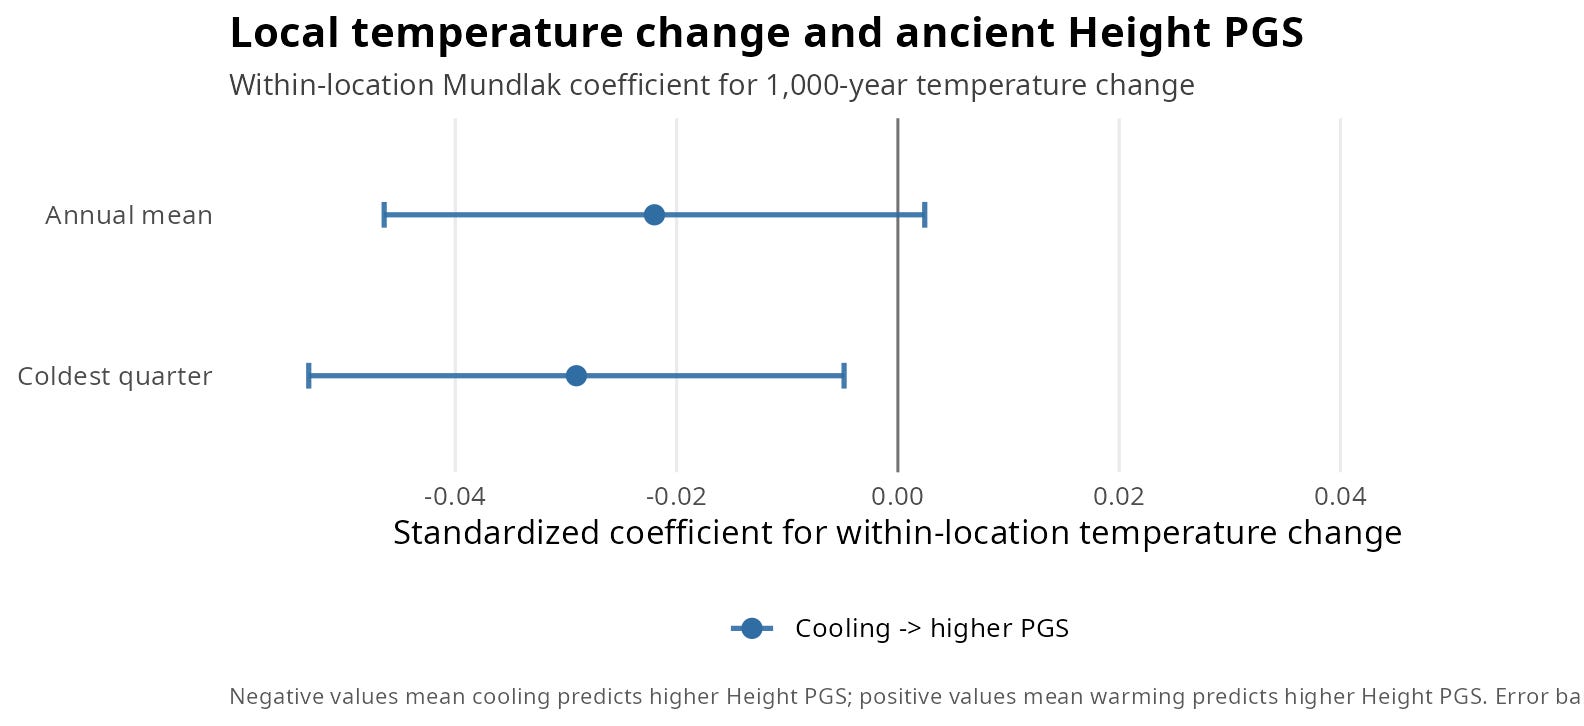
In a standard linear regression, the resulting coefficient (beta = -0.0291, p = 0.0186) implies a clean, symmetrical relationship: cooling predicts higher height polygenic scores, and warming predicts lower ones.
We can see this general direction when we split the raw data by the direction of the climate trend:
Table 2. Height PGS by Direction of 1,000-Year Winter Temperature Change
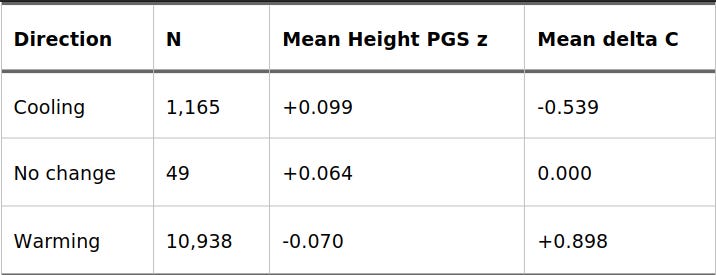
The Symmetrical Trap: It’s Only the Cold That Matters
Linear models force data to fit a perfectly symmetrical narrative: if cold does X, warmth must do the exact opposite of X. But evolutionary history and climate shifts are rarely so neat.
To test if this relationship was actually symmetrical, I ran a split-slope diagnostic. This allowed the model to calculate entirely separate slopes for cooling trends and warming trends.
Table 3. Asymmetric Cooling and Warming Slopes
(Note: Both cooling and warming are calculated here as positive magnitudes in degrees Celsius to compare their direct strengths.)
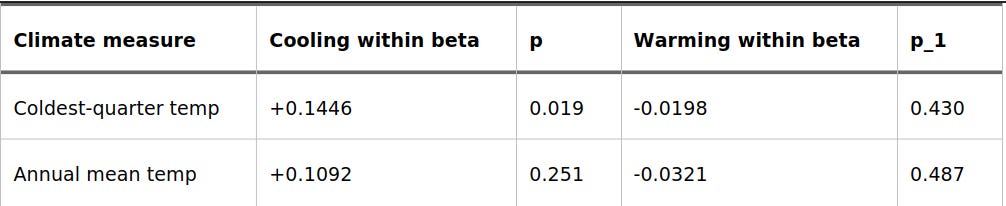
This sensitivity check shatters the clean linear assumption. For the height score, the winter cooling slope carries almost the entire signal. It is strong, pronounced, and statistically significant (p = 0.019). Meanwhile, the warming slope—though pointing in the expected negative direction—is weak, flat, and statistical noise (p = 0.430).
Furthermore, the between-location version of this change variable shows absolutely no effect (beta = -0.008, p = 0.725). If this entire signal were just a proxy for “traditionally cold regions have taller people,” that between-location term would be dominant. Instead, the genetic action is happening strictly within populations experiencing a historical downswing in winter temperatures.
Why Climate History Beats Geography
Height is a highly heritable physical trait with well-documented links to thermoregulation, resource availability, and metabolic constraints. If an arbitrary, non-physical trait showed this exact same specific pattern, it could easily be dismissed as an artifact of statistical noise.
What this framework changes is how we evaluate climate-genetic interactions. By shifting the focus to within-location historical deviations, we move past the uninterpretable cross-sectional map. We are no longer just looking at a continent and observing that the colder north happens to have a higher genetic predisposition for height.
Instead, we are isolating specific historical points. We are showing that when a region grew colder over a millennium, later individuals from that exact location tended to display higher height polygenic scores.
While this signal cannot yet disentangle the precise underlying mechanism, which could involve direct selection, local climate-driven population replacements, or complex migratory mixtures, it demonstrates that a population’s localized climate history carries predictive information that baseline climate levels completely miss.
The bottom line: Ancient height polygenic scores are not simply elevated because a population resides in a cold environment; they are specifically elevated in populations whose local environments recently became colder.
"The bottom line: Ancient height polygenic scores are not simply elevated because a population resides in a cold environment; they are specifically elevated in populations whose local environments recently became colder."
How does this comport with the very tall and very short tribes of sub-Saharan Africa?