
Did Farming Leave a Mutational Fingerprint?

For most of human history, grain was not something people piled into large storage rooms for months at a time. Once farming changed that, it also changed the ecology of the human food supply. Stored grain can rot. Fungi can grow. Some of those fungi produce poisons that do not merely make people sick, but damage DNA.
That is the starting point of a hypothesis suggested to me by Dr. József Kukolya. The idea is that the Neolithic shift to large-scale grain cultivation and storage created better conditions for *Aspergillus flavus*, raising chronic exposure to aflatoxin B1. Aflatoxin is famous in cancer genetics because it leaves a recognizable scar: G>T-like mutations, especially in the SBS24/AFB1 mutational signature.
The speculative evolutionary version is this: if chronic aflatoxin exposure also increased germline mutation, then early agricultural populations may have received extra mutational input biased toward G>T changes. If some of that input was useful, then derived alleles that rose under selection after the Neolithic should show a slight excess of G>T-like changes, especially among variants with stronger inferred positive selection.
This is not a claim that aflatoxin explains human evolution. It is a narrower molecular test: when we look at selected derived alleles, is there a detectable tilt toward G>T?
I used the selection summary statistics from Akbari et al.’s 2026 paper. In that file, `S` is the estimated selection coefficient for the ALT allele: positive `S` means ALT is inferred to have risen in frequency, while negative `S` means the other allele is favoured by the model.
There is one small complication. The hypothesis is about derived alleles, but Akbari’s `S` is written for ALT, and ALT is not always the derived allele. So I first identified which allele was ancestral and which was derived. Then I flipped the sign of `S` whenever necessary so that `S_derived` always means the inferred selection coefficient for the derived allele. Larger positive `S_derived` means a stronger inferred rise of the derived allele.
The first version of this analysis used all filtered variants and produced a strong-looking trend. But that was too optimistic, because millions of nearby variants are not independent observations. For this revision, I LD-pruned the Akbari variant list using 1000 Genomes Phase 3 EUR genotypes and PLINK2:
After LD pruning, 118,567 variants remained; 78,635 had the favoured allele as derived.
I tested two mutation classes: strict G>T, and strand-collapsed G>T/C>A.
Before looking at selection strength, I first checked the simple average: do all favoured-derived variants have more G>T than the non-rising variants? Table 1 reports that comparison. It is not significant. In the LD-pruned data, the favoured-derived variants are actually a little lower than background.
Table 1. Overall G>T-like enrichment after LD pruning
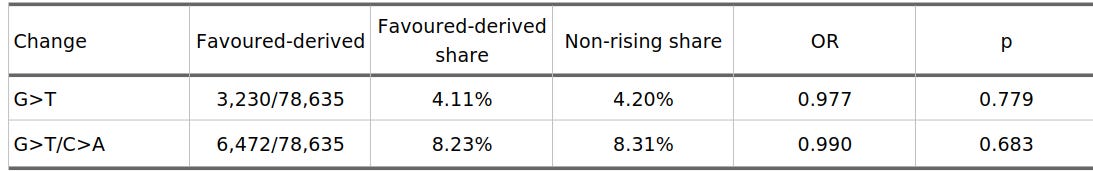
So the significant result in this analysis is not a blanket excess of G>T among all favoured-derived variants. The signal, if there is one, is in the gradient: whether G>T-like changes become more common as `S_derived` gets larger.
The original hypothesis predicts more than a global average. It predicts that the G>T-like signal should become stronger as the inferred selection coefficient gets larger. To test that, I split the favoured-derived variants into twenty equal-count bins by `S_derived` and compared each bin to the same non-rising LD-pruned background. Table 2 summarizes the correlation tests across those bins.
Table 2. Correlation between bin mean S_derived and G>T-like enrichment
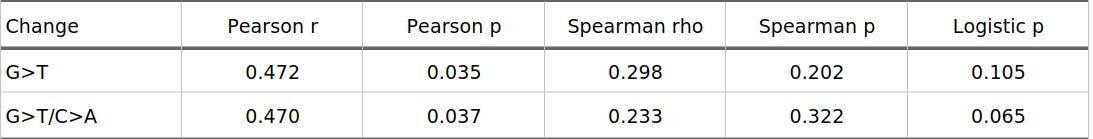
Figure 1 shows the main positive result. Each point is one of the twenty `S_derived` bins. The y-axis is enrichment relative to the non-rising background, so values above zero mean that a bin has more of that mutation class than expected from the comparison set. Under the 1000kb/r2=0.1 LD-pruned analysis, strict G>T enrichment correlates with mean `S_derived` at r = 0.472 (p = 0.035), and strand-collapsed G>T/C>A shows almost the same pattern at r = 0.470 (p = 0.037). In other words, the bins with stronger inferred derived-allele selection tend to be more G>T-like.
Figure 1. LD-pruned bin-wise enrichment
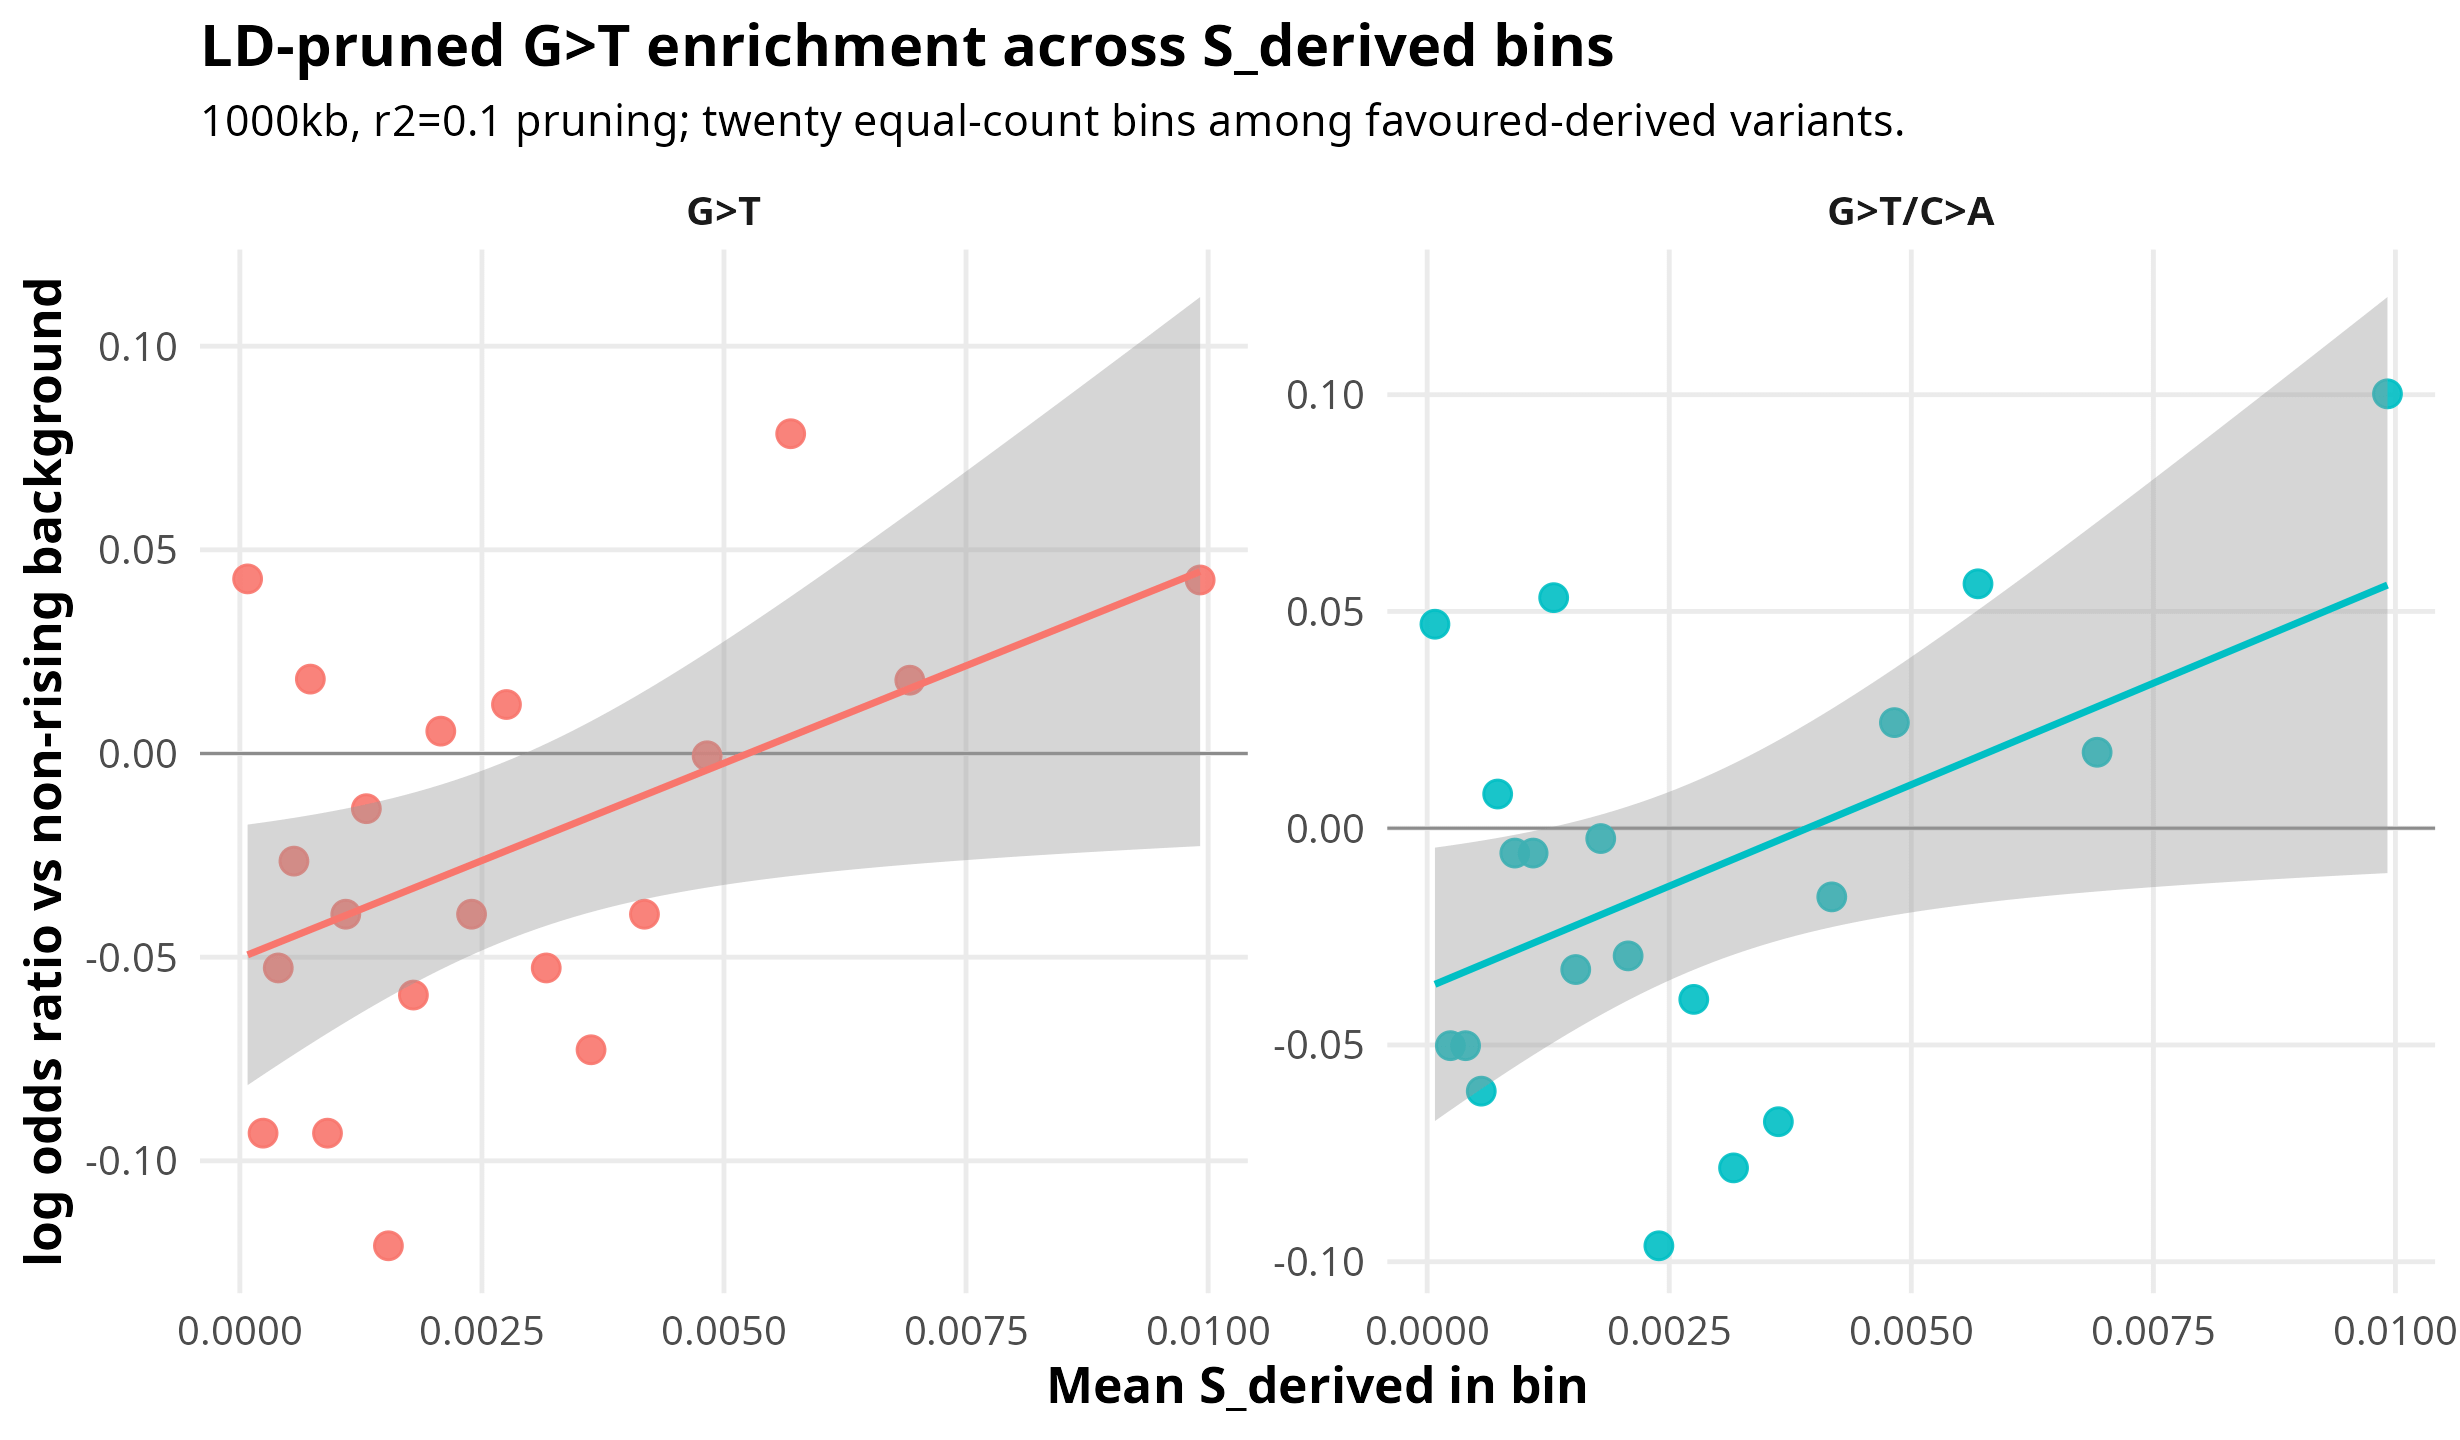
The plot also shows the main caveat. This is not a smooth staircase. The points are noisy, and the signal is clearest as a Pearson trend across bins rather than as a monotone increase in every adjacent bin.
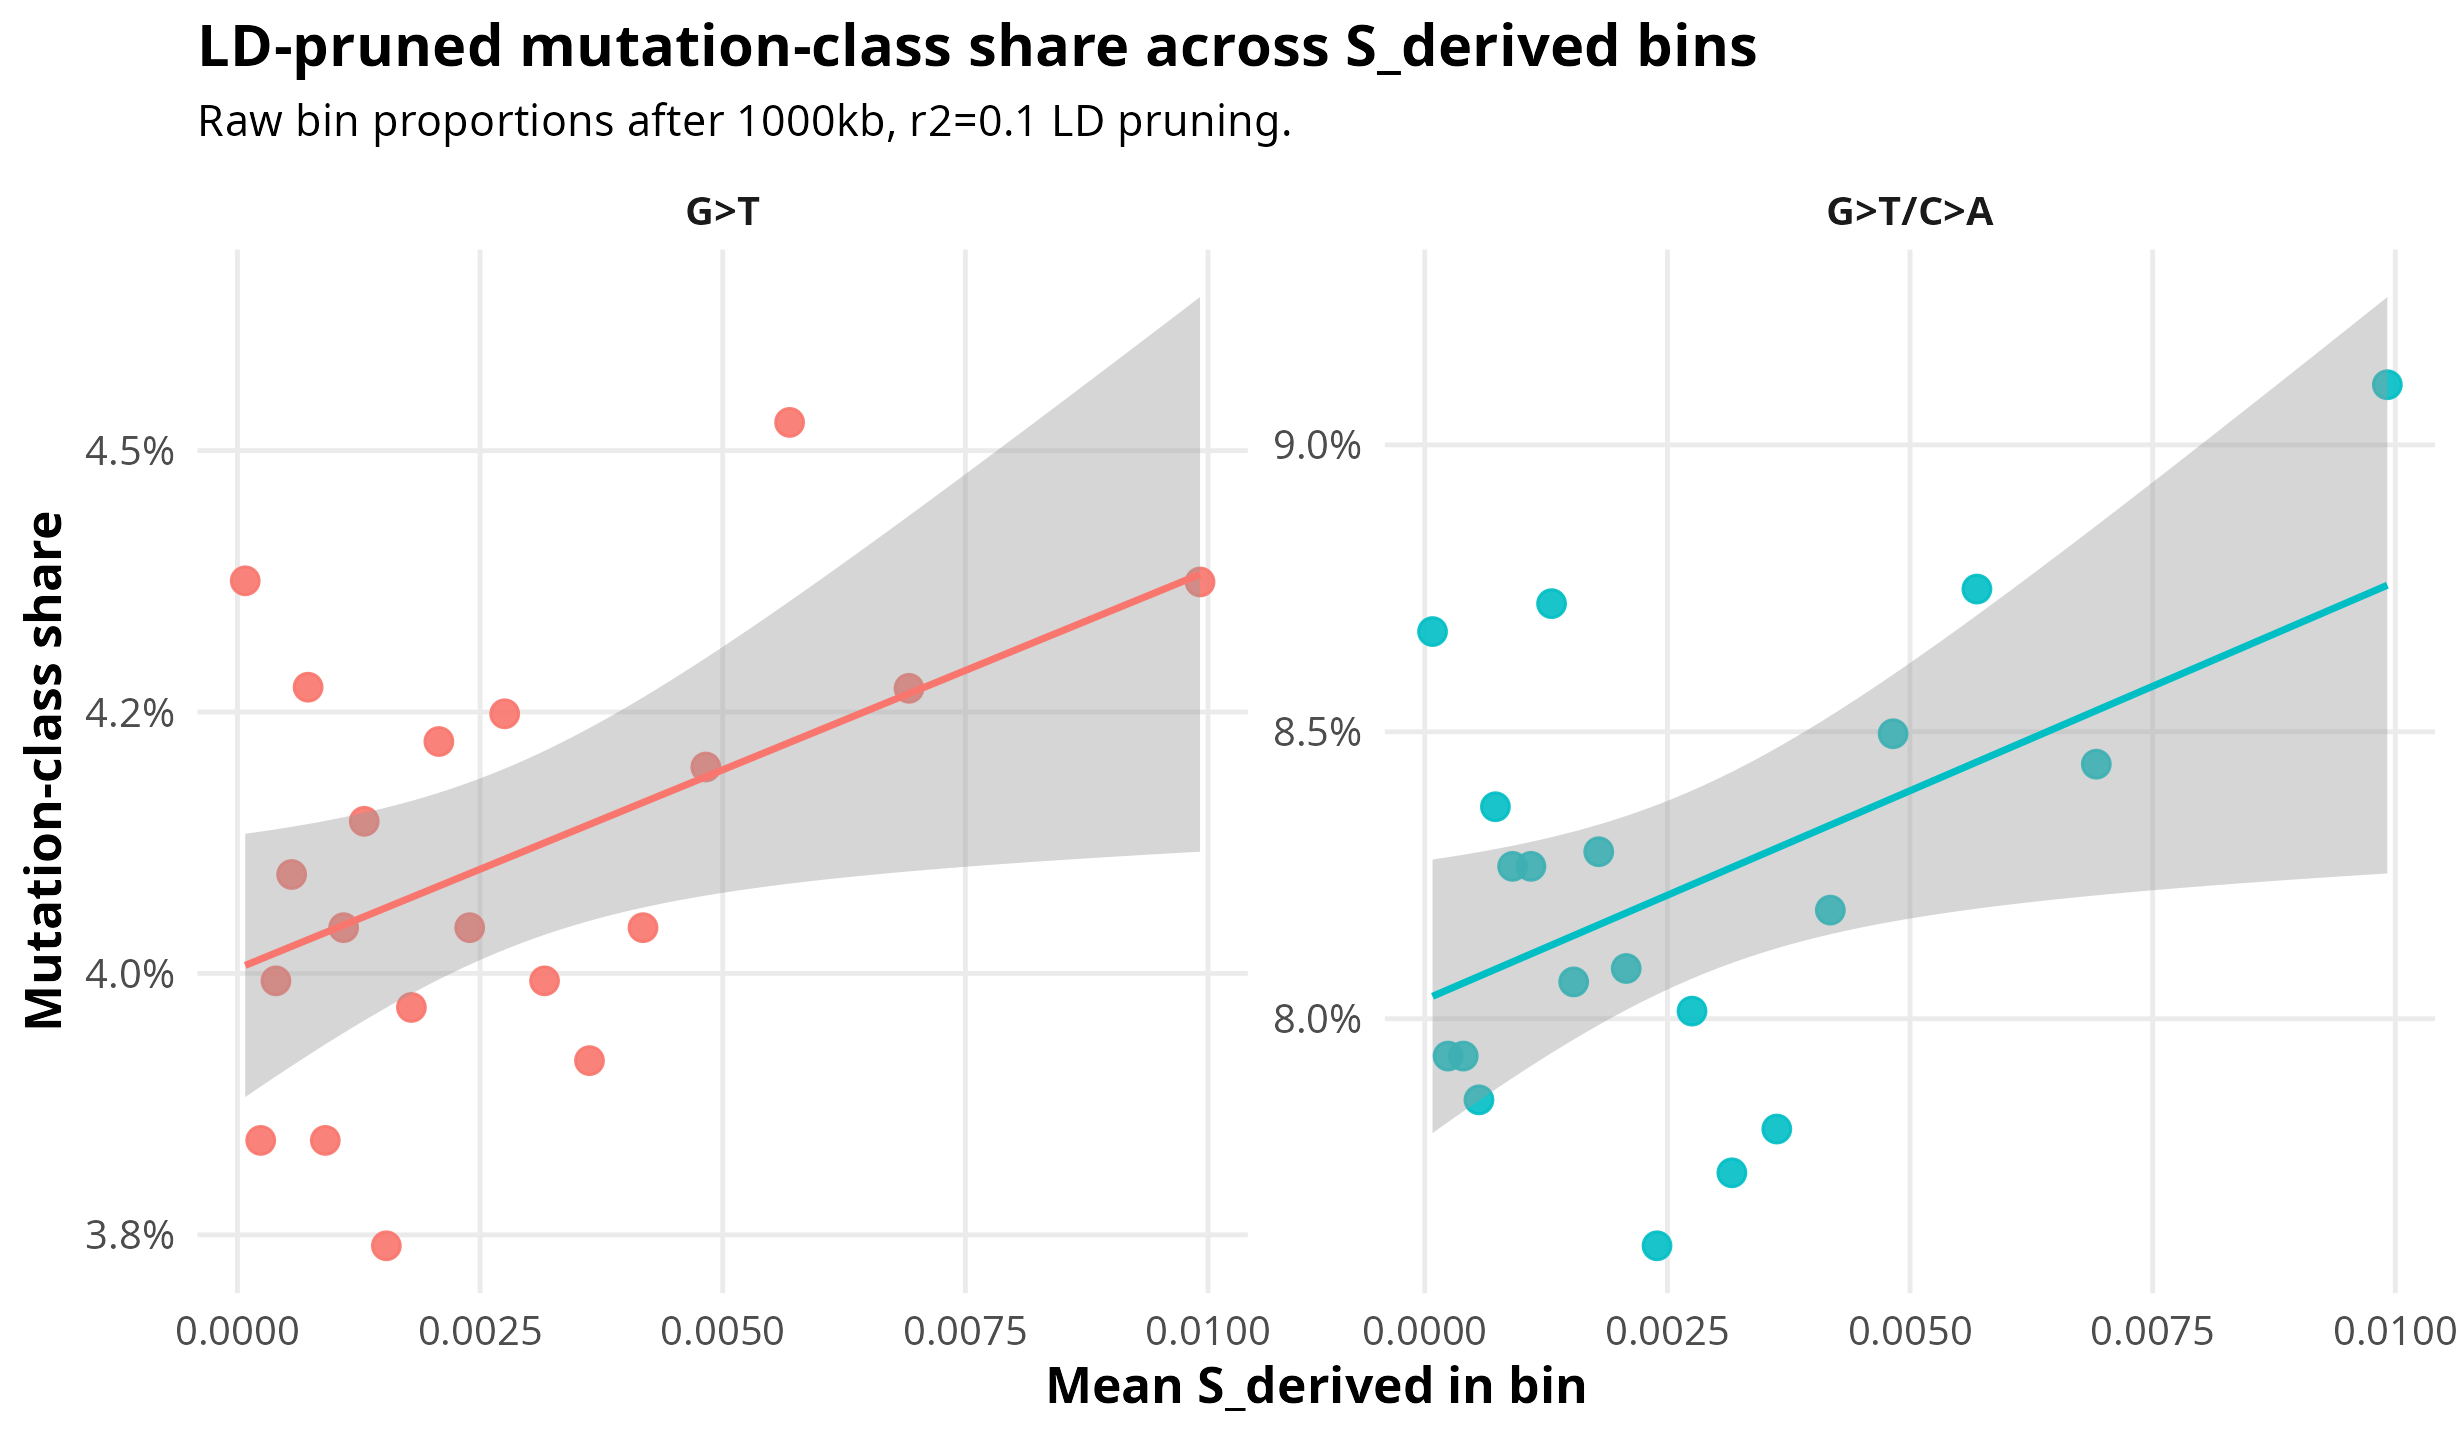
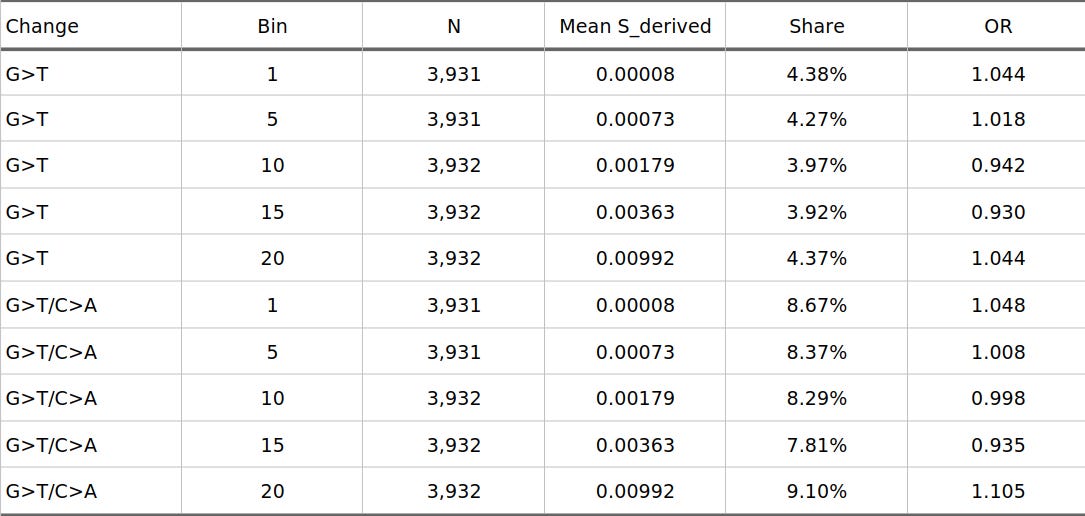
Figure 2 puts the same result on the raw-proportion scale. This is useful because odds ratios can make a small compositional shift look visually larger than it is. In absolute terms, the effect is modest: for G>T/C>A, the first bin is 8.67% and the last bin is 9.10%. For strict G>T, the endpoints are nearly flat. The positive Pearson result is coming from the shape across all bins, not from a simple first-bin-versus-last-bin contrast.
Figure 2. Raw bin proportions
To make the bin pattern easier to inspect numerically, Table 3 pulls out five points from the twenty-bin series: the first bin, three middle positions, and the highest-`S_derived` bin.
Table 3. Selected bins across the S_derived range
Discussion
The unpruned result was too strong. LD pruning removes the global average excess and forces the conclusion to become narrower. What remains is the binned result: under the 1000kb/r2=0.1 pruning rule, G>T-like enrichment is positively correlated with `S_derived` across bins.
That is not proof of an aflatoxin mechanism. It is a surviving hint in the right direction. The fair interpretation is: no overall enrichment after LD pruning, but a significant Pearson bin-wise association between inferred selection strength and G>T-like mutation class, with weaker support from rank and logistic tests.
The next test should be more specific than the one in this post. Here I treated all G>T and G>T/C>A changes as if they were equally aflatoxin-like. That is only a rough proxy. Aflatoxin does not just produce generic G>T mutations; it tends to produce G>T changes in particular local sequence contexts.
In other words, the neighboring bases matter. A G>T change inside AGA is not molecularly identical to a G>T change inside CGC or TGG. Cancer geneticists describe this as trinucleotide context: the changed base plus the base immediately before it and the base immediately after it. SBS24, the aflatoxin-like signature, is defined at that more detailed level.
So the more precise version of the test is to take each selected SNP, recover the two neighboring bases from the reference genome, orient the mutation from ancestral allele to derived allele, and then ask whether the high-`S_derived` variants are enriched for the specific trinucleotide contexts expected under SBS24. A generic G>T trend is suggestive. A trend concentrated in SBS24-like contexts would be much stronger evidence for the proposed aflatoxin mechanism.
References
Kukolya, József. Personal communication; source of the aflatoxin-agriculture hypothesis tested here.
Akbari, A., Perry, A., Barton, A.R. et al. (2026). *Ancient DNA reveals pervasive directional selection across West Eurasia*. *Nature*. https://doi.org/10.1038/s41586-026-10358-1
Alexandrov, L.B. et al. (2020). *The repertoire of mutational signatures in human cancer*. *Nature*, 578, 94-101. https://doi.org/10.1038/s41586-020-1943-3
Huang, M.N. et al. (2017). *Genome-scale mutational signatures of aflatoxin in cells, mice, and human tumors*. *Genome Research*, 27, 1475-1486. https://doi.org/10.1101/gr.220038.116
COSMIC Mutational Signatures. SBS24/AFB1-like signature. https://cancer.sanger.ac.uk/signatures/sbs/sbs24/
Interesting, thanks.