
Did Grit, Not IQ, Drive the Rise in Educational Genetics?
GWAS-by-subtraction meets prehistory: which component actually increased?

Educational Attainment is a messy phenotype. It reflects cognitive ability, but it also reflects everything that helps people translate ability into years of schooling: motivation, self regulation, persistence, planning, and other “noncognitive” traits.
That distinction motivates a common objection to ancient DNA time series of EDU polygenic scores. Even if EDU PGS rose over time, critics argue, the change could mostly reflect noncognitive traits that make people easier to educate, rather than any change in cognition.
Fortunately, we now have a way to put this criticism to the test. GWAS-by-subtraction provides a way to decompose the genetic signal for educational attainment into two components: a Cog component tied to cognitive performance, and a Noncog component capturing genetic variance in education not explained by cognitive performance (Demange et al., 2021).
A separate line of work then asks what the “noncognitive” component actually does in living cohorts. Using twin and polygenic score analyses, Malanchini et al. (2024) report that genetic dispositions linked to noncognitive skills become increasingly predictive of academic achievement across development, consistent with the idea that these traits matter more and more as schooling progresses.
In this post I take that Cog and Noncog decomposition and apply it to ancient genomes by computing polygenic scores using the lead SNP lists reported by Demange et al. (2021) for the Cog and Noncog components.
The question is straightforward: when we track both components through time, which one shows the stronger increase toward the present? If the standard objection is correct, the Noncog component should do most of the moving.
One caution up front. “Noncog” is not a pure personality score. In the GWAS-by-subtraction framework it is a residual component, and residualization is only as clean as the cognitive measure used to define it. Measurement error in cognitive performance will inevitably leave some cognitive signal inside “Noncog,” so treating it as a perfectly noncognitive construct is a mistake.
Noncog PGS
I start with the Noncog polygenic score and treat it as a time series in ancient genomes. The dataset includes several thousand imputed ancient individuals spanning roughly the last few tens of thousands of years, sampled across Western Eurasia. Because the composition of the sample changes over time and space, the regression includes the major ancestry components (Anatolian Farmer, WHG, Steppe), latitude, and sequencing coverage. The goal is simple: estimate the association with sample age while reducing the chance that the time trend is just a proxy for population turnover, geography, or data quality.
Across all specifications, the coefficient on Date (measured in years BP) is negative and highly significant, implying that Noncog PGS rises toward the present. This time trend remains when controlling for ancestry composition (Anatolian Farmer, Western Hunter Gatherers/WHG, Steppe), sequencing coverage, and latitude. Coverage itself has no detectable effect, indicating that the result is not driven by data quality differences between ancient samples.
The figure below summarizes these regressions. Each point is a standardized coefficient and the horizontal bars are 95% confidence intervals, shown for the full model (including latitude) and the same model without latitude for comparison.
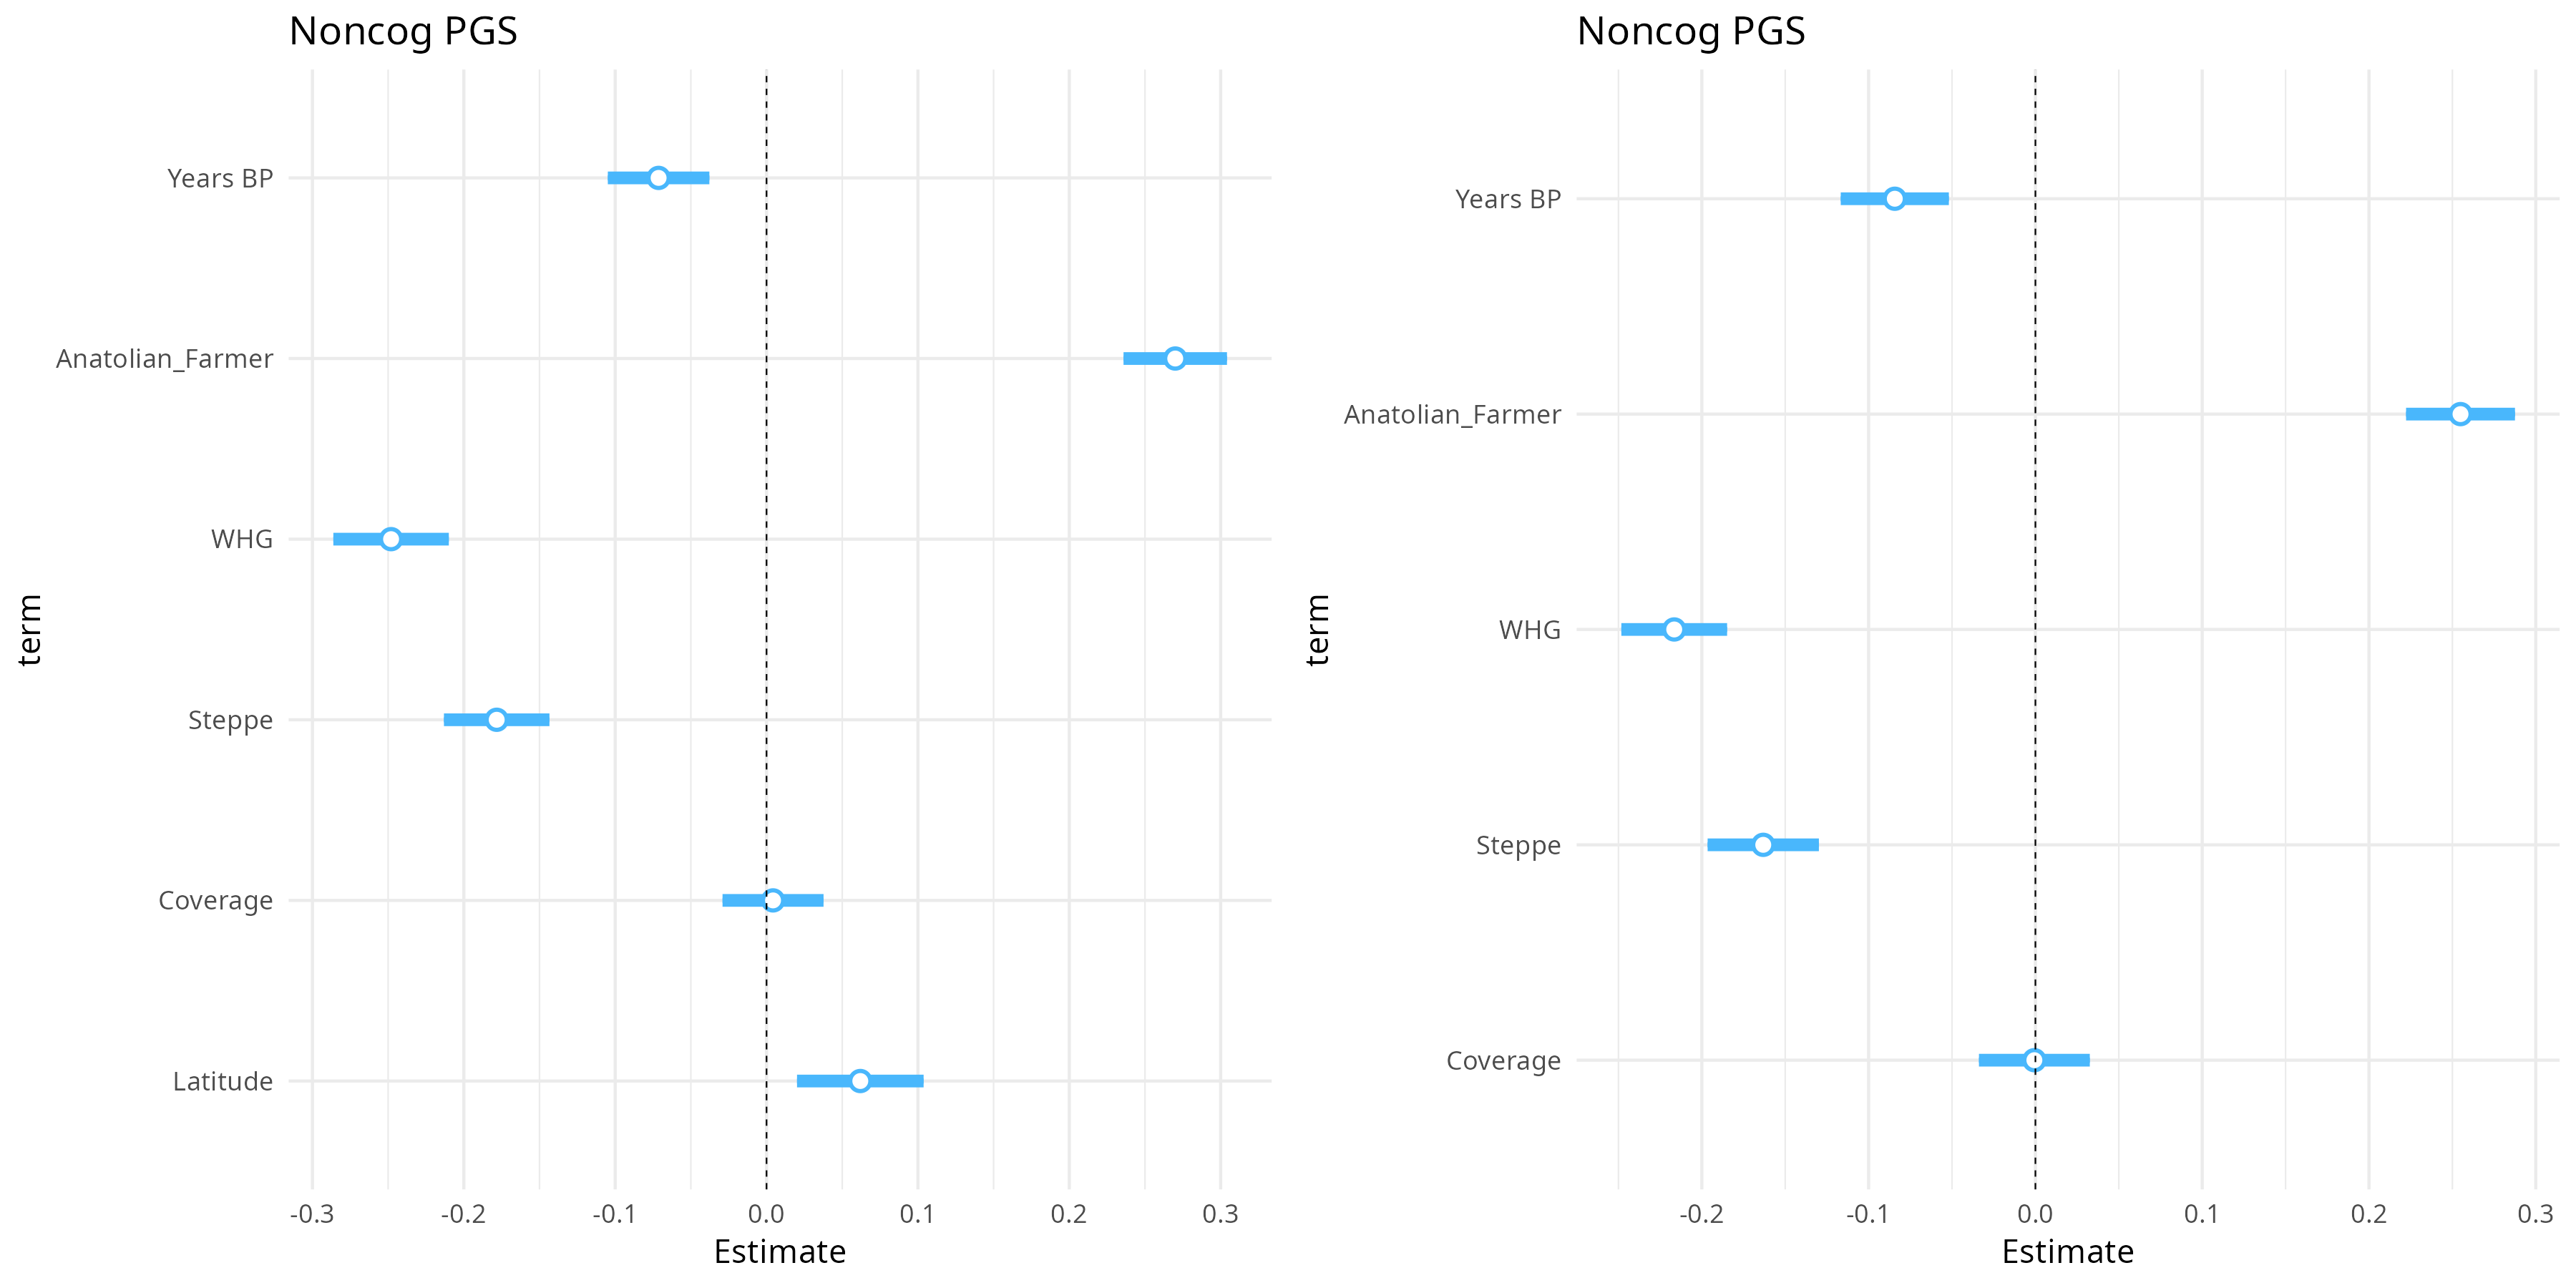
Ancestry components show large and stable associations. The reference group is the Southern Levant/Mesopotamia ancestry component. Anatolian Farmer ancestry is positively associated with Noncog PGS, while WHG and Steppe ancestry are negatively associated. These effects are consistent across models and do not eliminate the independent effect of time.
In addition to temporal change, the Noncog PGS displays a geographic pattern. Latitude is positively associated with Noncog PGS. This suggests that the latitude gradient is not a by-product of temporal structure or population mixture.
Hinge regressions reveal no sharp discontinuity in the time trend. Instead, the increase in Noncog PGS appears gradual, with negative slopes both before and after 12,000 BP and only modest evidence for a change in slope. Restricting the analysis to samples younger than 12,000 BP yields the same qualitative results.
Taken together, these findings establish that noncognitive-related genetic variation increased over time and contributed to the long-run rise in Educational Attainment polygenic scores. However, they do not by themselves demonstrate that this component dominates the overall EDU signal. The decisive question is: does the Cognitive component show a weaker trend, as the “it’s all noncognitive” objection implies, or does it rise just as much, or more. That is what the next section tests.
