
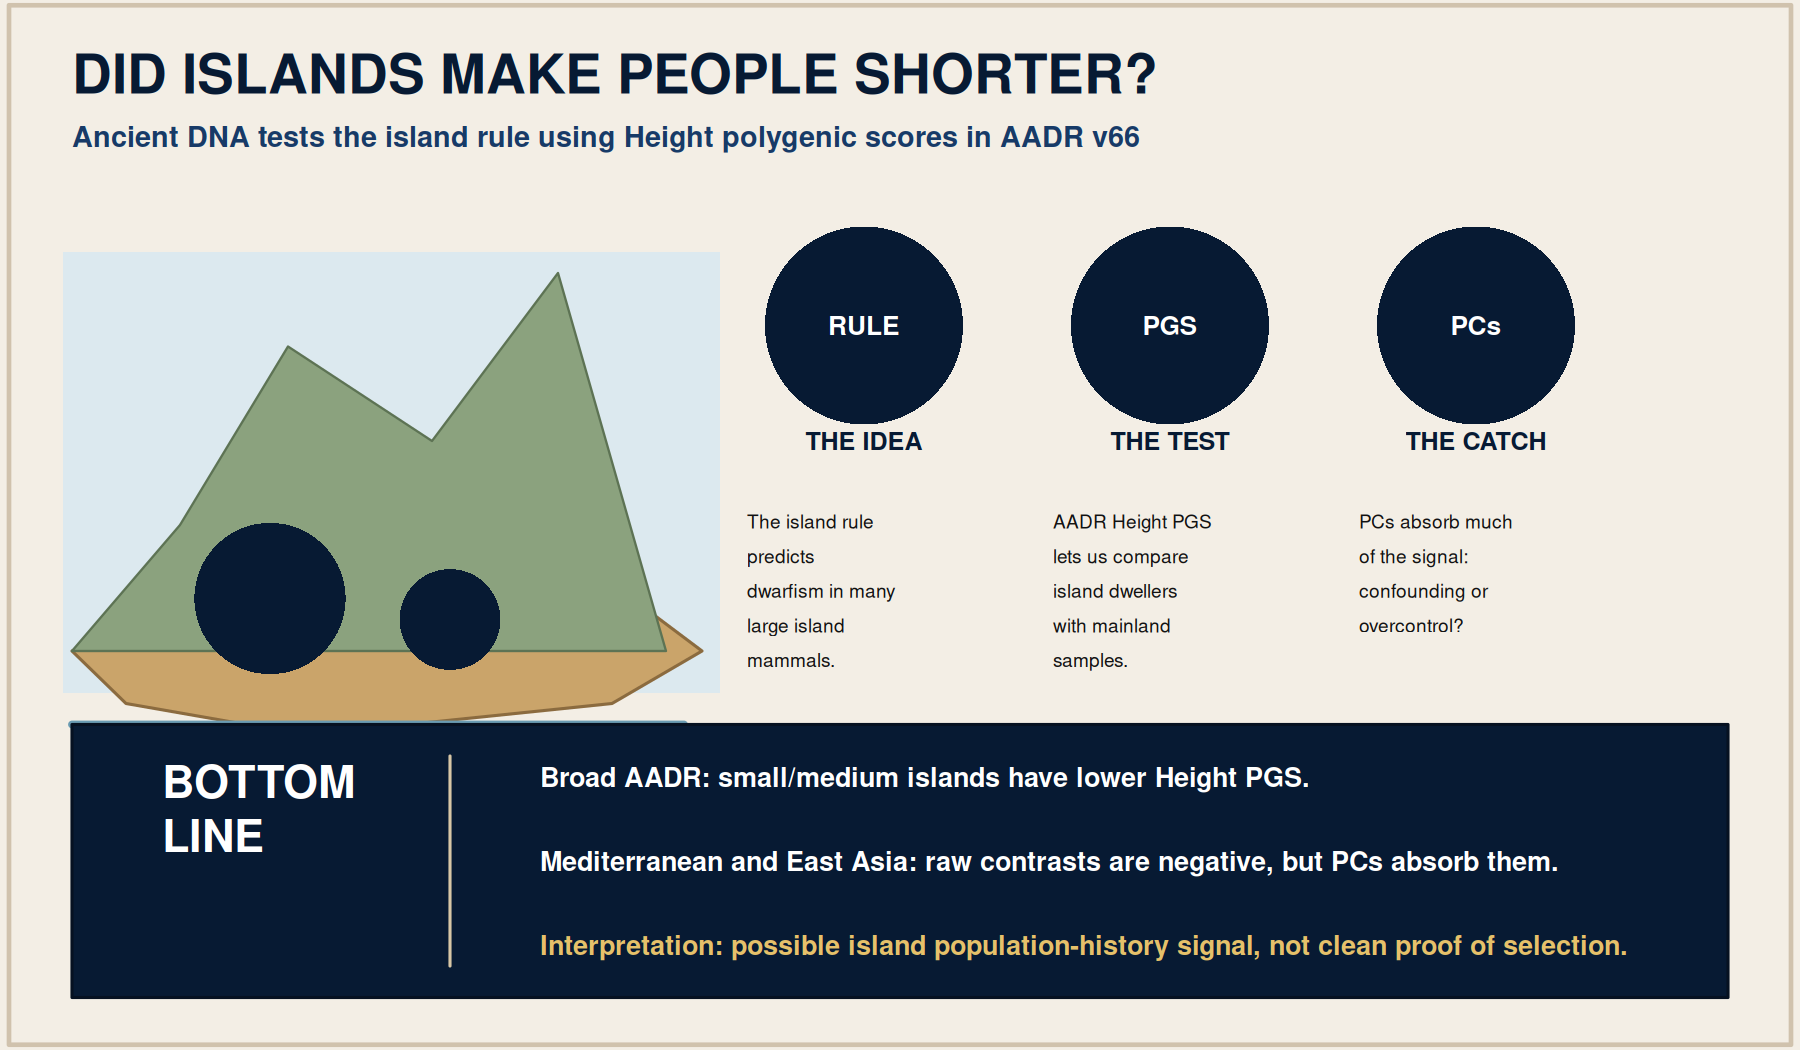
Did Islands Make People Shorter?

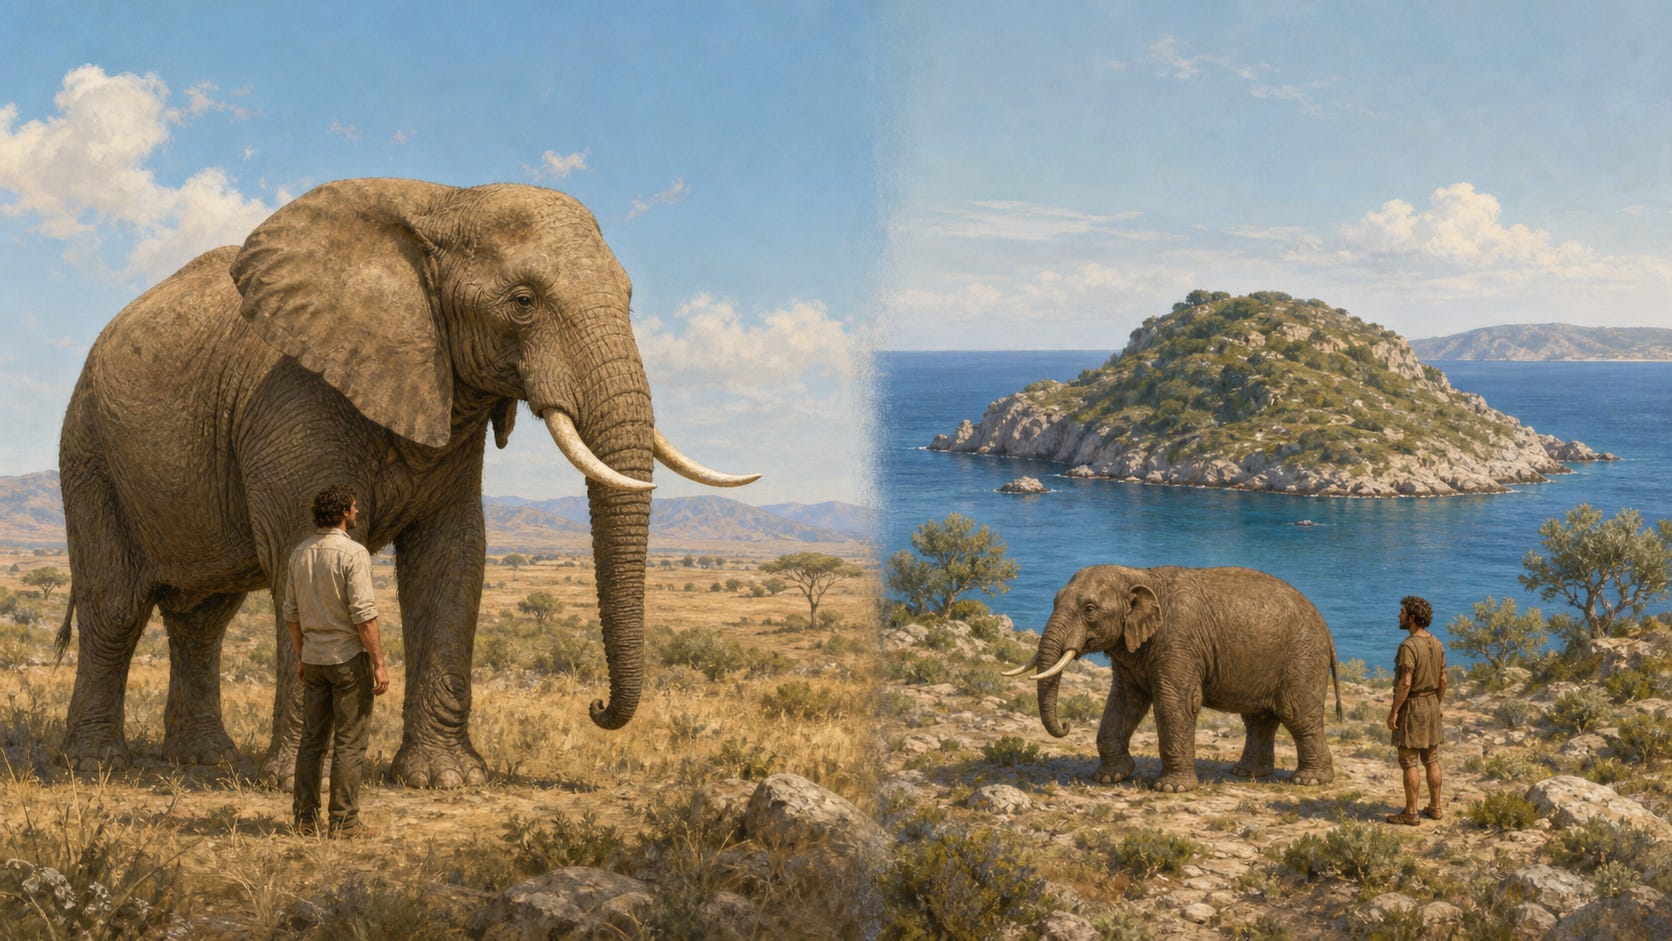
Island biology has one of the most memorable rules in evolution: when large animals are trapped on islands, they often get smaller. Dwarf elephants lived on Mediterranean islands. Pygmy mammoths lived on the Channel Islands off California. Dwarf hippos are known from islands such as Cyprus, Crete, Malta, and Madagascar. The usual explanation is not mystical. Islands are small, isolated, resource-limited worlds, and large bodies can become expensive.
The pattern is usually called the island rule. It is strongest and most famous in mammals, but broader reviews have also looked across terrestrial vertebrates. The rule is not that every island species shrinks. Small animals may become larger, large animals often become smaller, and the effect depends on island size, isolation, climate, predators, competitors, and founding history.
The obvious human hook is Homo floresiensis, the small-bodied hominin from Flores, Indonesia. Its exact evolutionary history remains debated, but it made the question unavoidable: if islands can reshape body size in mammals, could island population history also leave a signal in humans?
Ancient and modern DNA offers us a different way to answer this question. I am not measuring skeletons here. I am using Height polygenic scores from AADR v66 and asking whether island dwellers have lower genetic propensity for height than mainland samples. The test is imperfect, but it is useful because it separates the descriptive island-mainland contrast from the harder question of whether that contrast survives ancestry adjustment.
Methods Note
I used the AADR v66 dataset, merged the Height PGS score file, and added projected AADR PCs. I excluded archaic hominins and non-human primates. Present-day and ancient samples are both retained in the broad analysis.
The primary island label is deliberately conservative. Large islands such as Britain, Ireland, Japan, Taiwan, Iceland, and Greenland are identified, but the main small-island contrast excludes them. The small/medium island set includes Sardinia, Sicily, Crete, Cyprus, Malta, the Balearics, Gotland, the Faroe Islands, the Canaries, Orkney/Shetland/Hebrides, and small Aegean islands.
The models use Height PGS standardized across the analysis dataset. Weighted regressions use the fraction of Height PGS SNPs observed in each sample. The main controls are date, genomic coverage, broad geographic region, and AADR PCs, depending on the specification.
Which Islands Are Actually Sampled?
Before interpreting any coefficient, the first question is whether AADR has enough island samples. The answer is yes for a first pass, especially for ancient Europe, but no for every island one might want. The strongest small/medium island groups are Sicily, Sardinia, Gotland, Crete, and Orkney/Shetland/Hebrides. Japan and Taiwan are large-island East Asian comparisons rather than part of the small-island test.
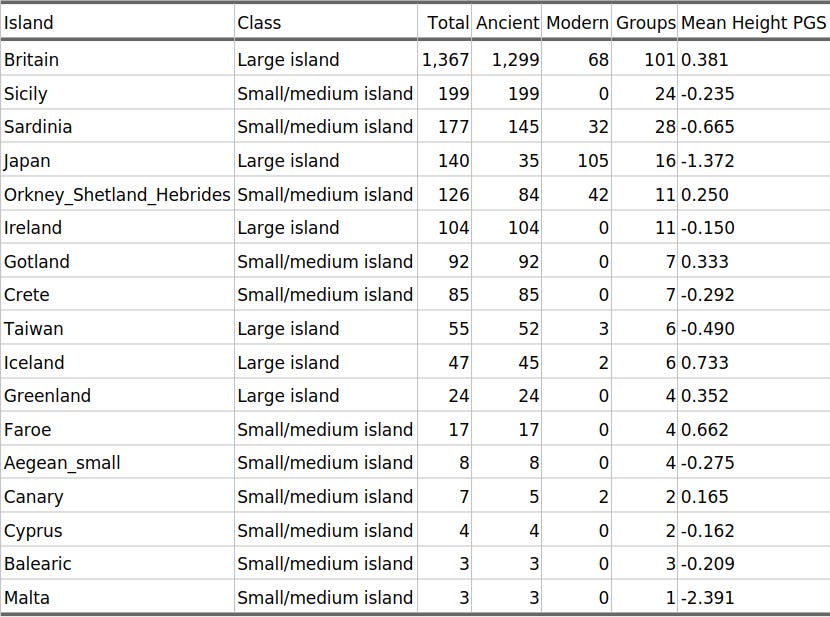
Table 1 lists island labels used in the map and models. Total N combines ancient and modern samples. Large islands are shown for context, but the primary broad island test uses only small/medium islands against mainland samples.
Table 1. Island populations with Height PGS in AADR
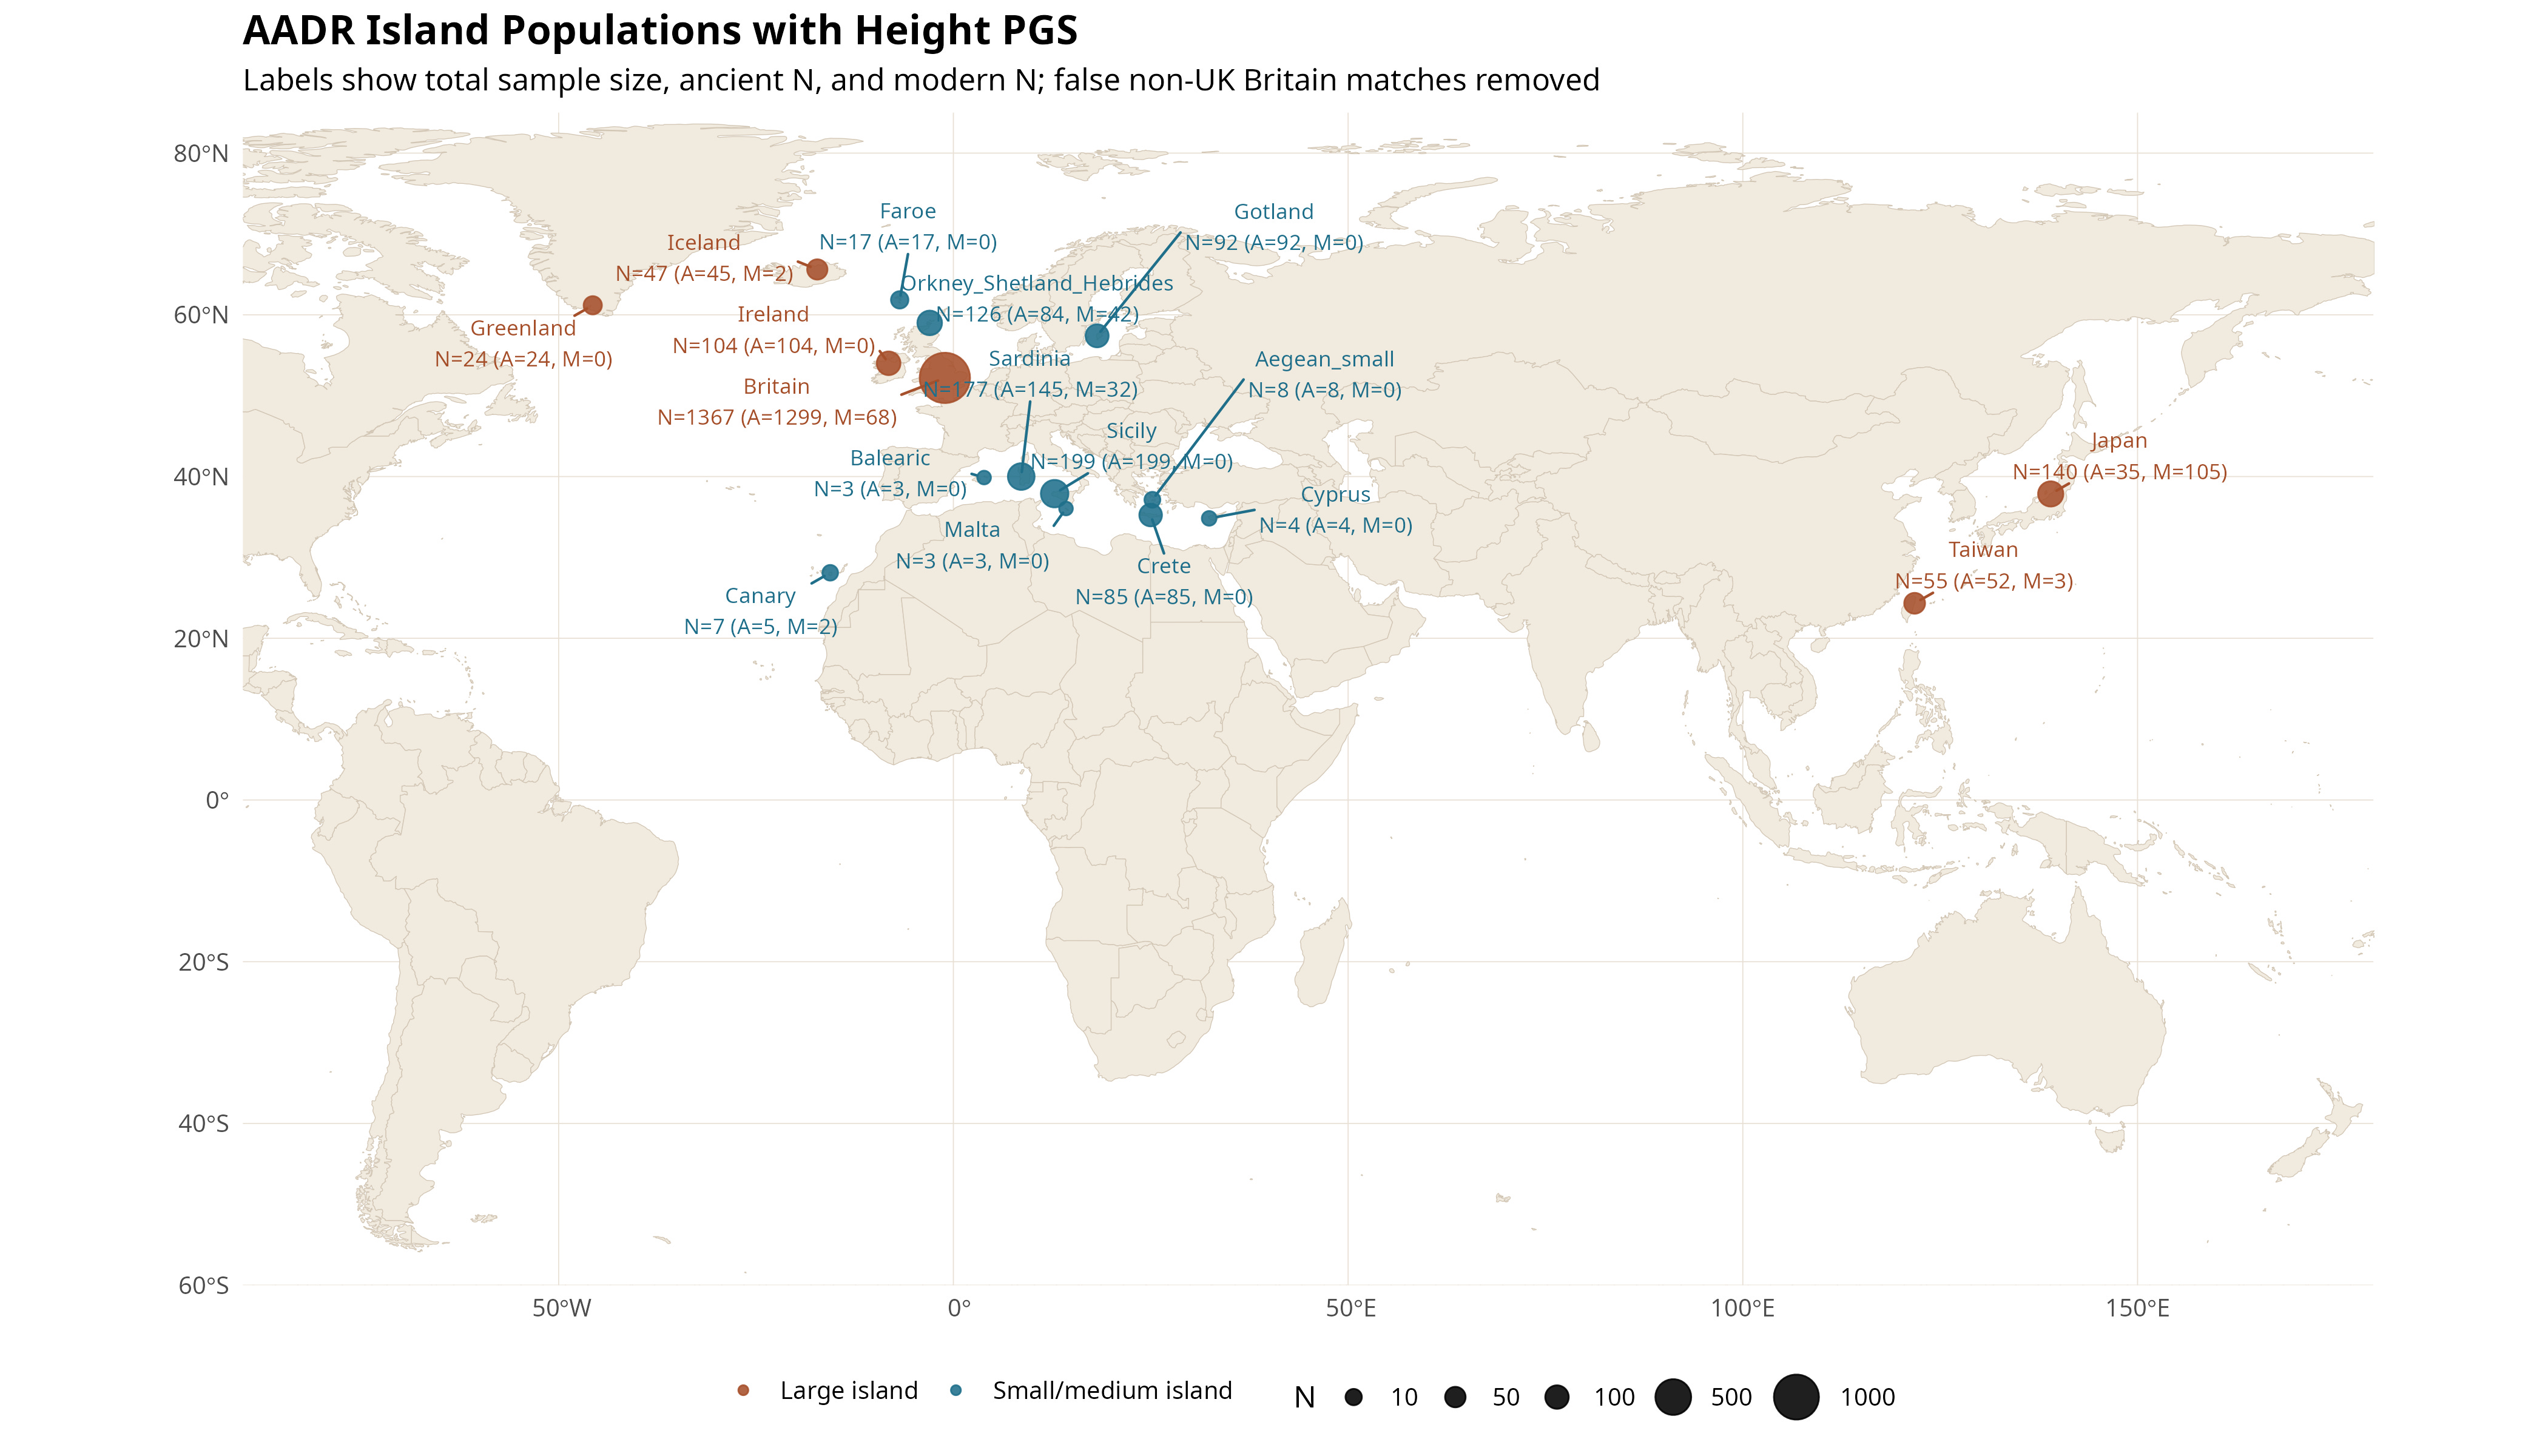
The map shows where the island-labelled samples are located. Labels report total N, ancient N, and modern N.
Figure 2. AADR island populations used in the analysis
The Broad AADR Contrast
I start with the bluntest test because it is the easiest one to understand: take all AADR samples labelled as small/medium islanders, exclude the large islands, and compare their standardized Height PGS with mainland samples. This is not the strongest design. It is a first-pass screen that asks whether the expected island-mainland contrast is visible before more local matching is imposed.
The dependent variable in every model in this section is standardized Height PGS. The coefficient of interest is the island indicator. A negative coefficient means that small/medium island samples have lower Height PGS than mainland samples.
The models differ in how much structure they try to remove. The raw model is just island status. The date-and-coverage model adds Years BP and Height SNP observed fraction, so it does not simply compare better-preserved or differently dated samples. The region model also adds broad geographic-region fixed effects. The PC model instead adds AADR PC1-PC5, which is the strongest ancestry adjustment in this broad section.
That last step is important, but it is also dangerous. PCs can remove ancestry confounding, but they can also remove real island population history if the island effect itself is carried by genome-wide structure. So the broad PC model should be read as a conservative ancestry-adjusted check, not as the whole answer.
Before looking at coefficients, Figure 3 shows the raw distribution in the broad ancient European sample. It is restricted to Europe/Anatolia/Caucasus because this is where the island sample is largest and the mainland comparison is most interpretable. Large islands are excluded. The plot is descriptive: it shows the contrast that the regressions then try to adjust for date, coverage, geography, and ancestry.
Figure 3. Ancient Europe island vs mainland Height PGS
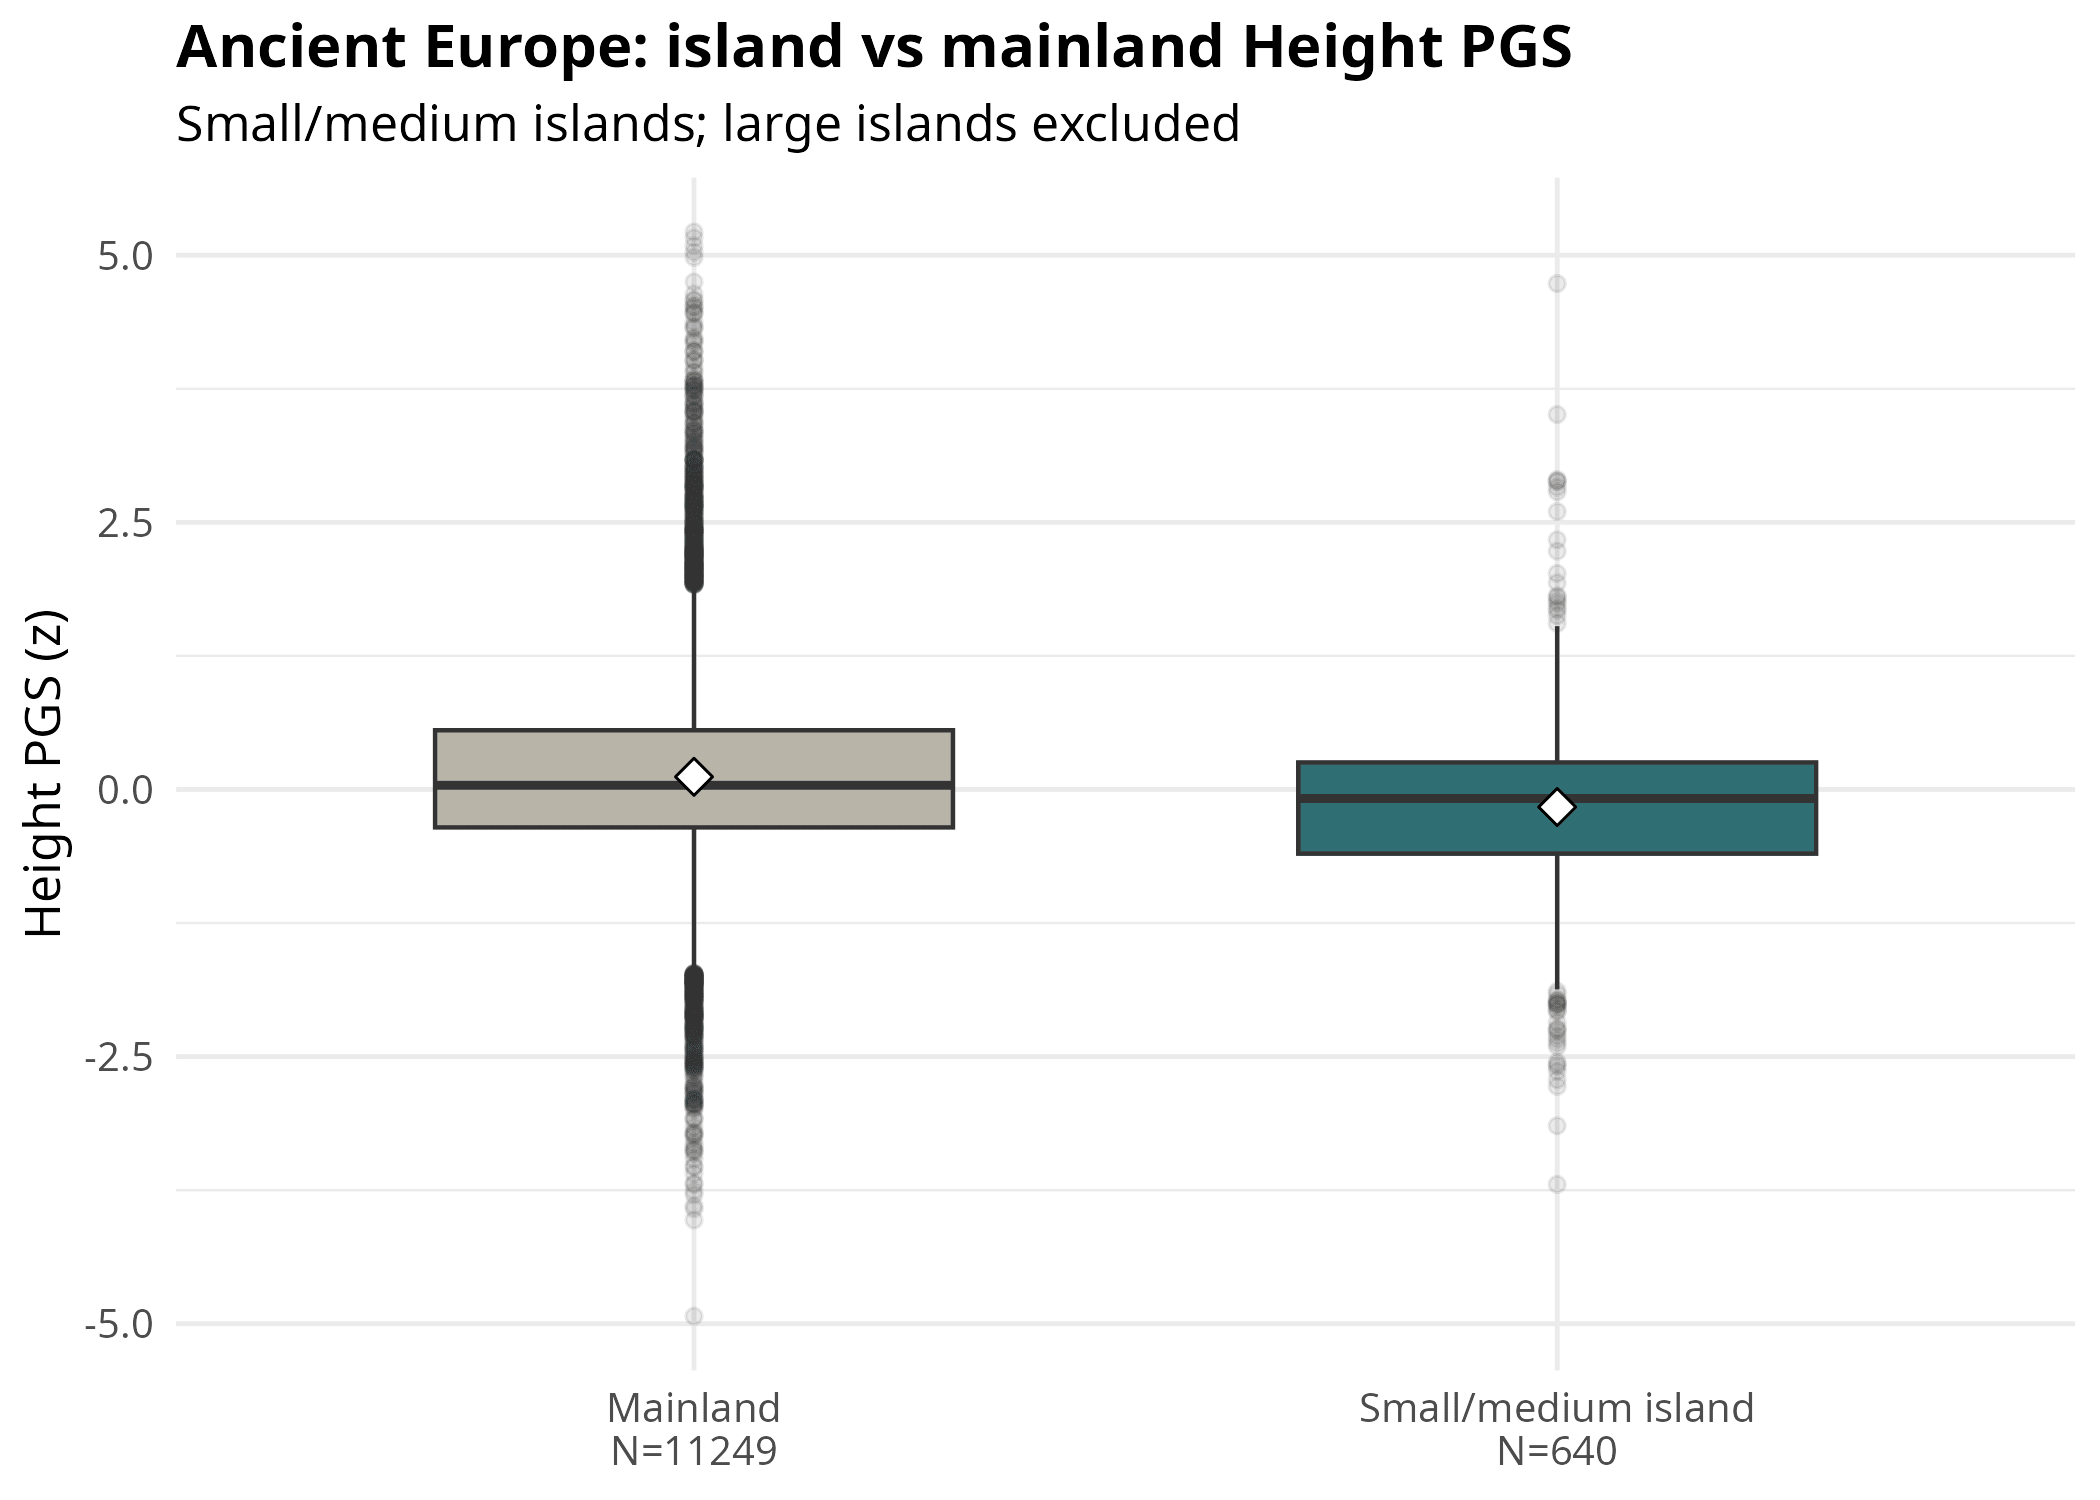
The broad result is the simple version of the story: island samples look shorter genetically. But this is exactly where the analysis has to become stricter. The real question is whether the signal survives when islanders are compared with nearby mainlanders from the same period, when groups rather than repeated individuals are matched, and when modern height is adjusted for economic development.
