
Eugenic clannishness, dysgenic inbreeding?

Our DNA carries traces of how our ancestors chose their mates and formed families. One of the clearest signals comes from runs of homozygosity (ROH): stretches of DNA where the two copies you inherited from your parents are identical across many consecutive markers. These segments appear when your parents share ancestors.
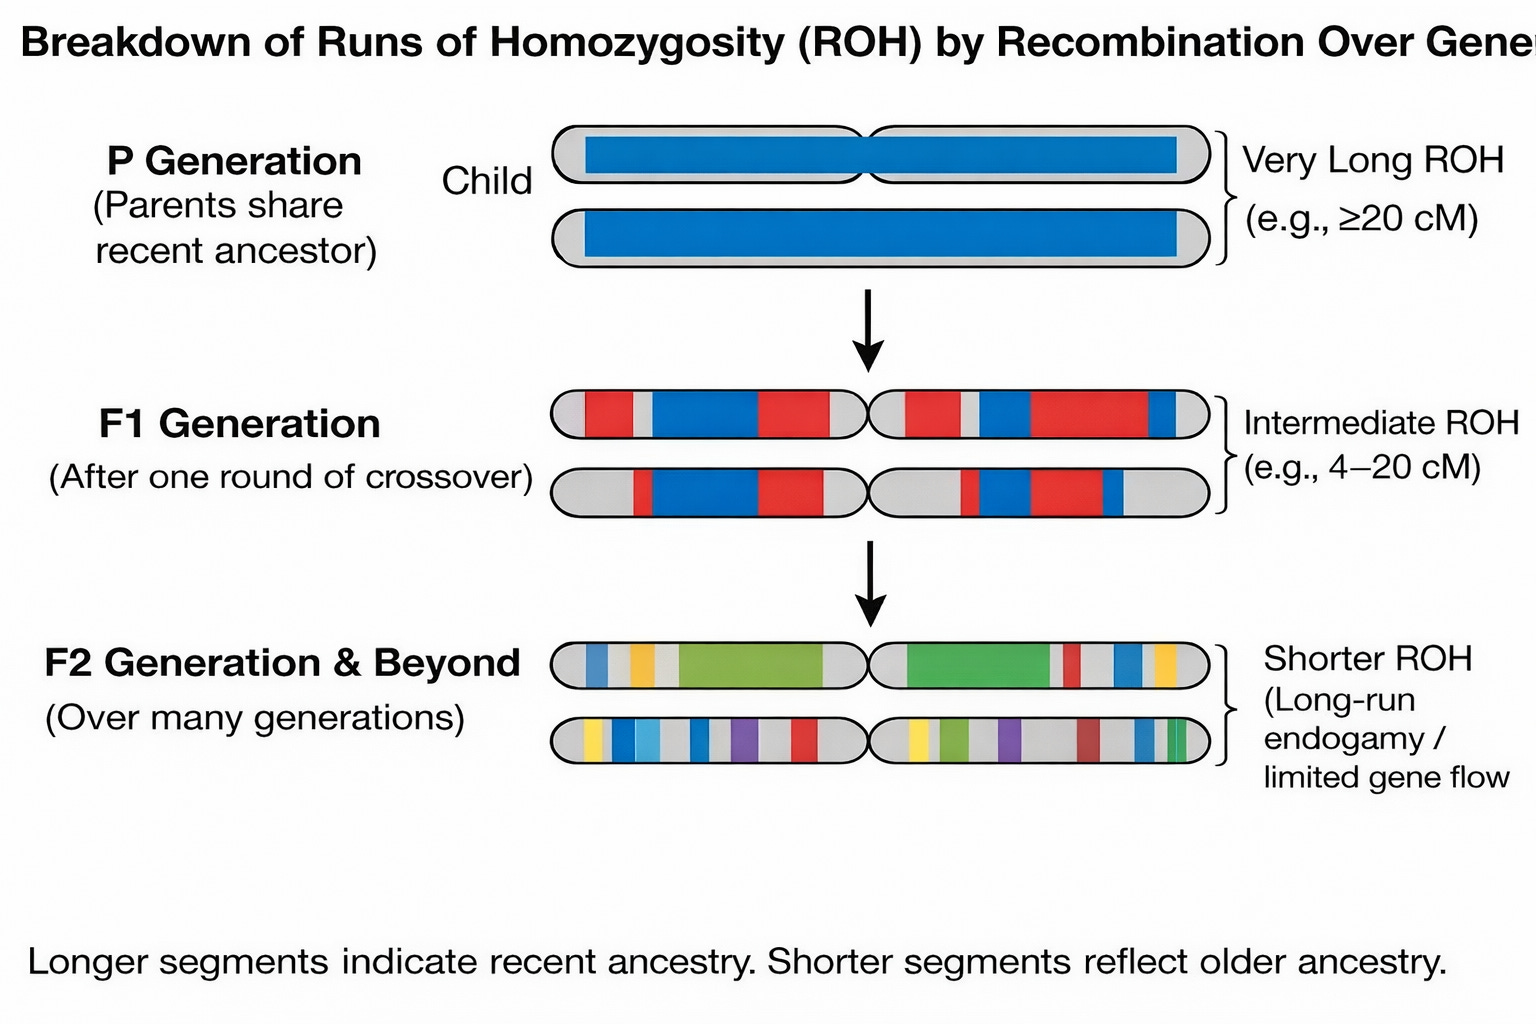
Recombination breaks these segments up each generation, so segment length reflects when the shared ancestry occurred.
Separating ROH by length distinguishes two regimes: very long ROH typically reflect recent close-kin unions (cousins and closer), while intermediate ROH can arise without recent cousin marriage and instead point to long-standing endogamy and limited gene flow, where communities stayed locally bounded for many generations.
The schematic below shows how recombination shortens shared segments over generations. In real populations, intermediate-length ROH usually arise not from a single distant cousin pair, but from long-standing endogamy and limited gene flow across many generations.
ROH are often treated as a warning label because close-kin marriage can reduce phenotypes through inbreeding depression: recessive harmful variants are more likely to be expressed when the genome becomes more homozygous. That mechanism is largely non-additive (dominance/recessivity).
Polygenic scores are useful here because they filter that channel out.
The scores used in this article are additive by construction: they are weighted sums of allele counts from GWAS. ROH can change whether recessive variants are expressed in the phenotype, but ROH do not mechanically “depress” an additive polygenic score in the same way. When ROH correlate with an education- or height-related polygenic score, the plausible channels run through allele-frequency differences across populations, sampling, and long-run selection or demographic sorting, rather than classic inbreeding depression within individuals.
In other words, this design allows the analysis to isolate population-level allele-frequency structure from the individual-level phenotypic consequences of inbreeding.
The analysis draws on ancient and modern genomes from the Allen Ancient DNA Resource (AADR) 1240k dataset, which provides standardized genotype calls, metadata, and population labels across time.
A further implication is that ROH length can serve as a proxy for mating regimes. Intermediate ROH points to long-run community closure, while very long ROH points to recent consanguinity and tighter constraints on mate choice. If mate choice itself shifts the strength of sexual selection, then ROH length classes offer an unusual window into sexual selection using ancient genomes. This type of design, to my knowledge, has not been tested in this context.
A directional time trend
Let’s start with time. Do these scores shift across millennia in a consistent direction?
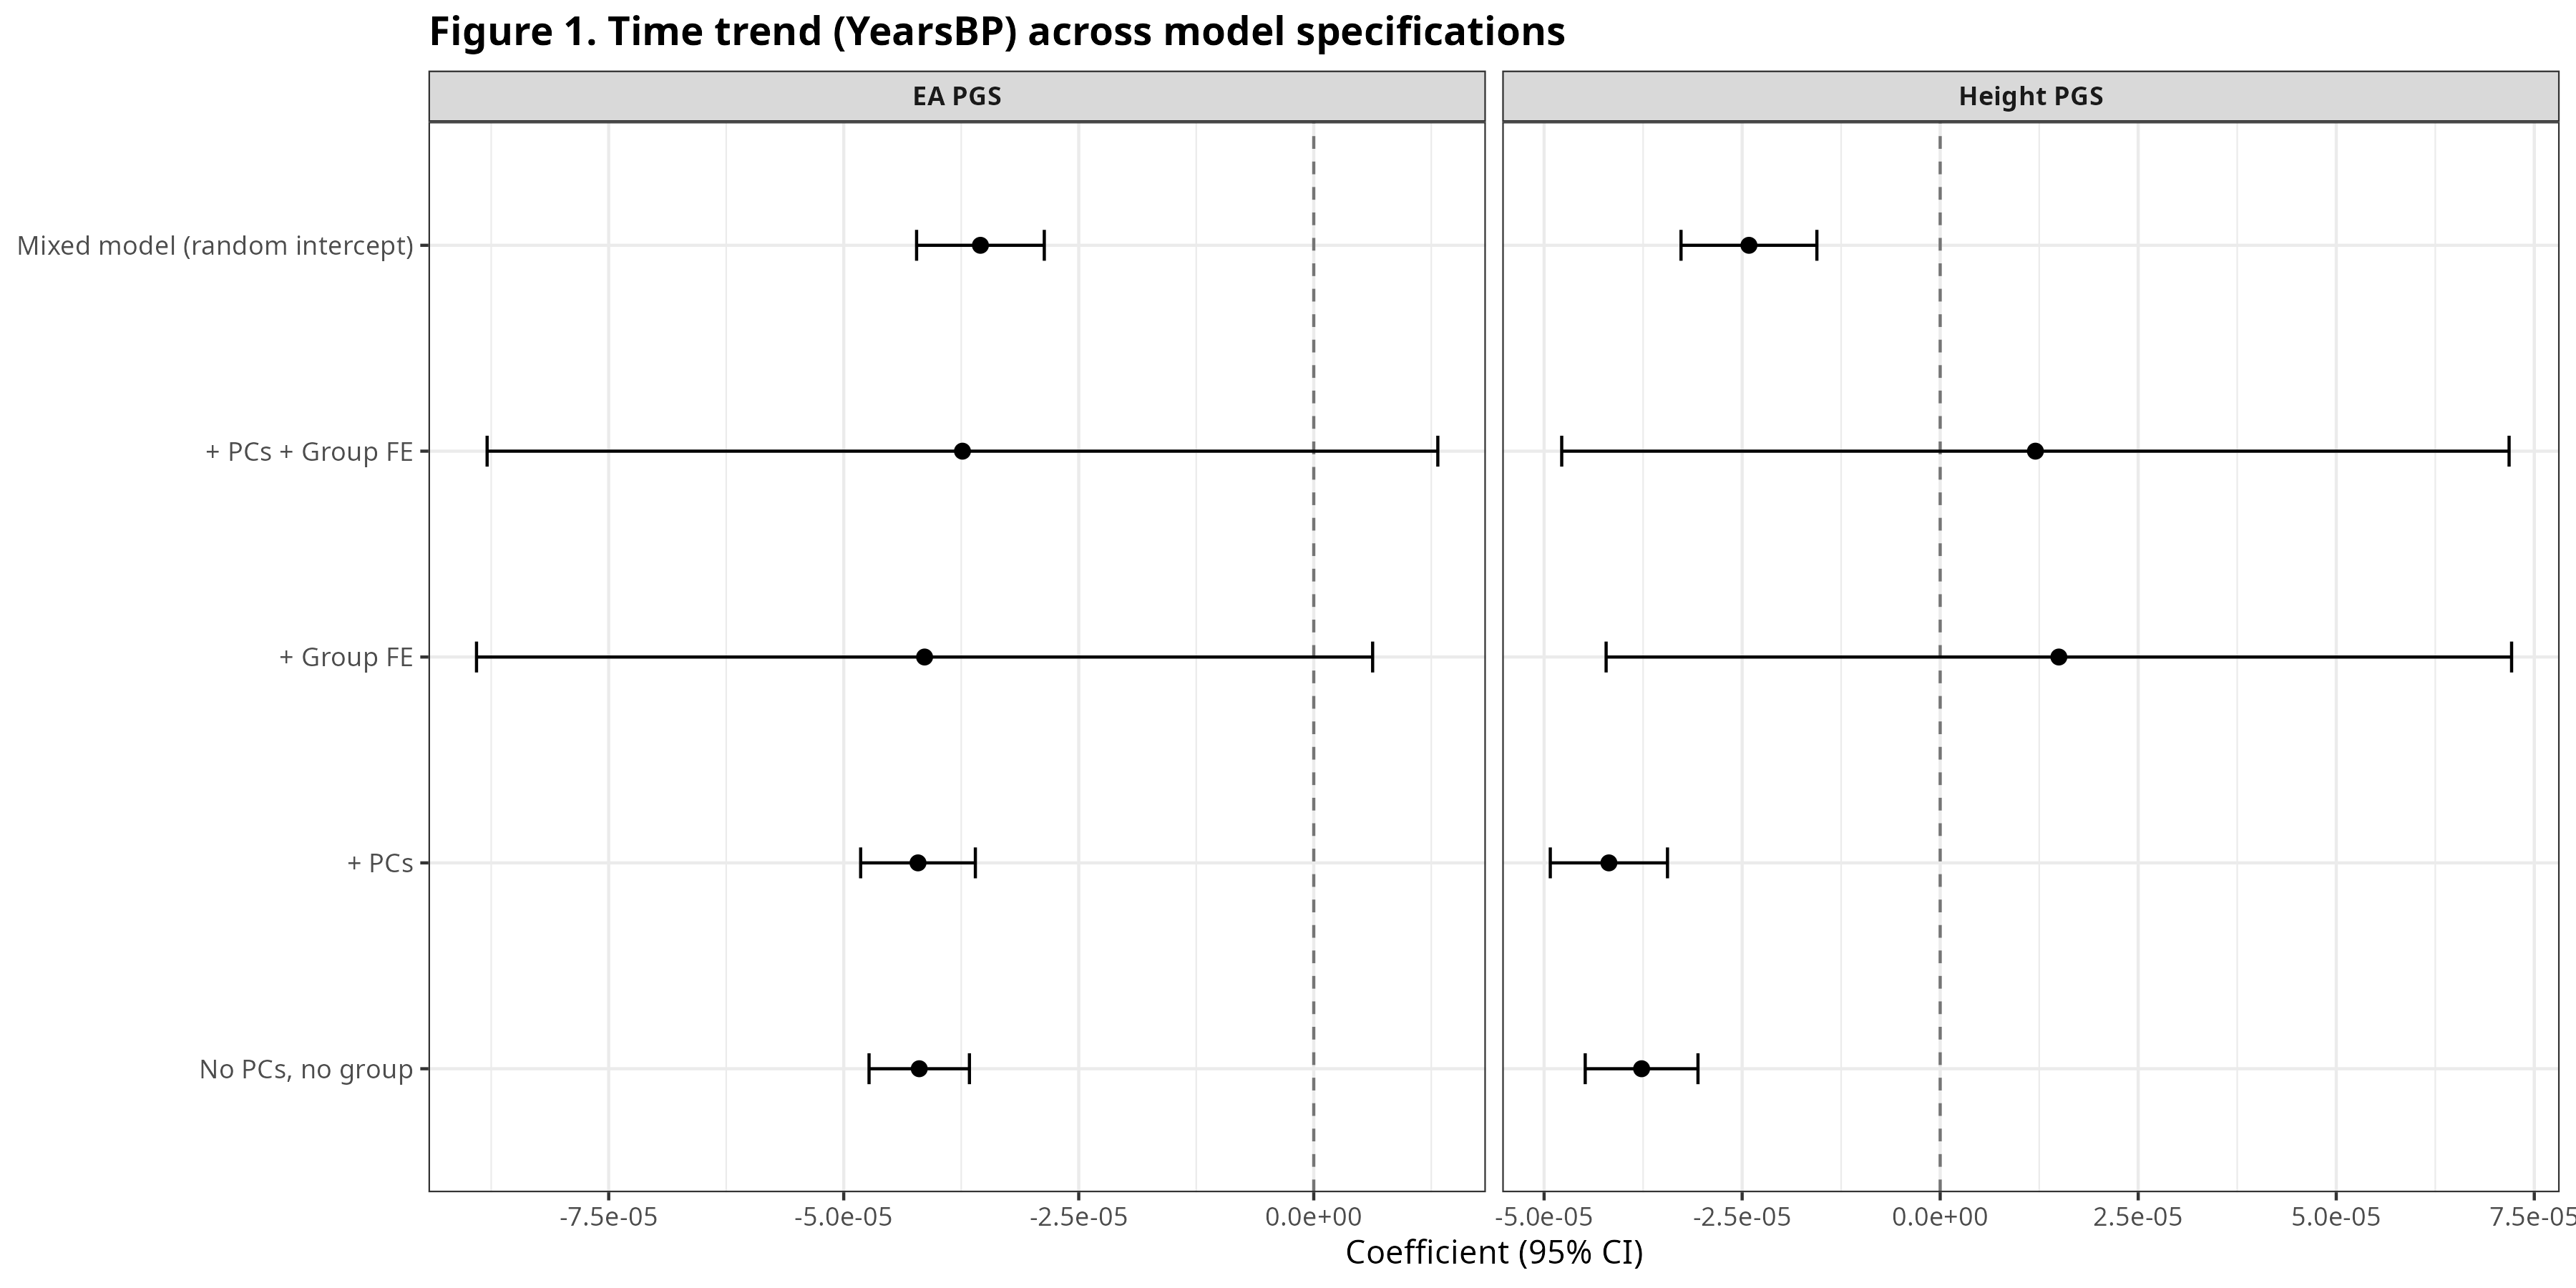
Figure 1 plots the coefficient on YearsBP (years before present) across a ladder of models for EA PGS and Height PGS: minimal controls, then ancestry PCs, then group fixed effects, then a mixed model.
A negative coefficient indicates higher scores closer to the present. For EA, the time slope is negative even in basic specifications and becomes extremely well-identified with ancestry PCs. For Height, the time slope is more specification-sensitive: it can look weak in some group fixed-effect models, yet turns strongly negative in PC-adjusted models that compare individuals within ancestry space.
EA shows a robust negative YearsBP slope across many models; Height shows the clearest negative slope once ancestry is controlled. This implies that these polygenic scores increased over time.
All regression figures are restricted to ancient individuals (YearsBP > 0).
Figure 1. Time trend (YearsBP) across model specifications.
Recent inbreeding vs long-run endogamy
Figure 2 separates homozygosity into two length-based components. The upper panel reports the regression coefficient for ROH ≥20 cM, which mainly captures recent close-kin mating. The lower panel reports the coefficient for ROH 4–20 cM, which more often reflects long-standing endogamy and limited gene flow at the community level, even in the absence of recent cousin marriage.
Figure 2. Recent close-kin vs long-run endogamy components.
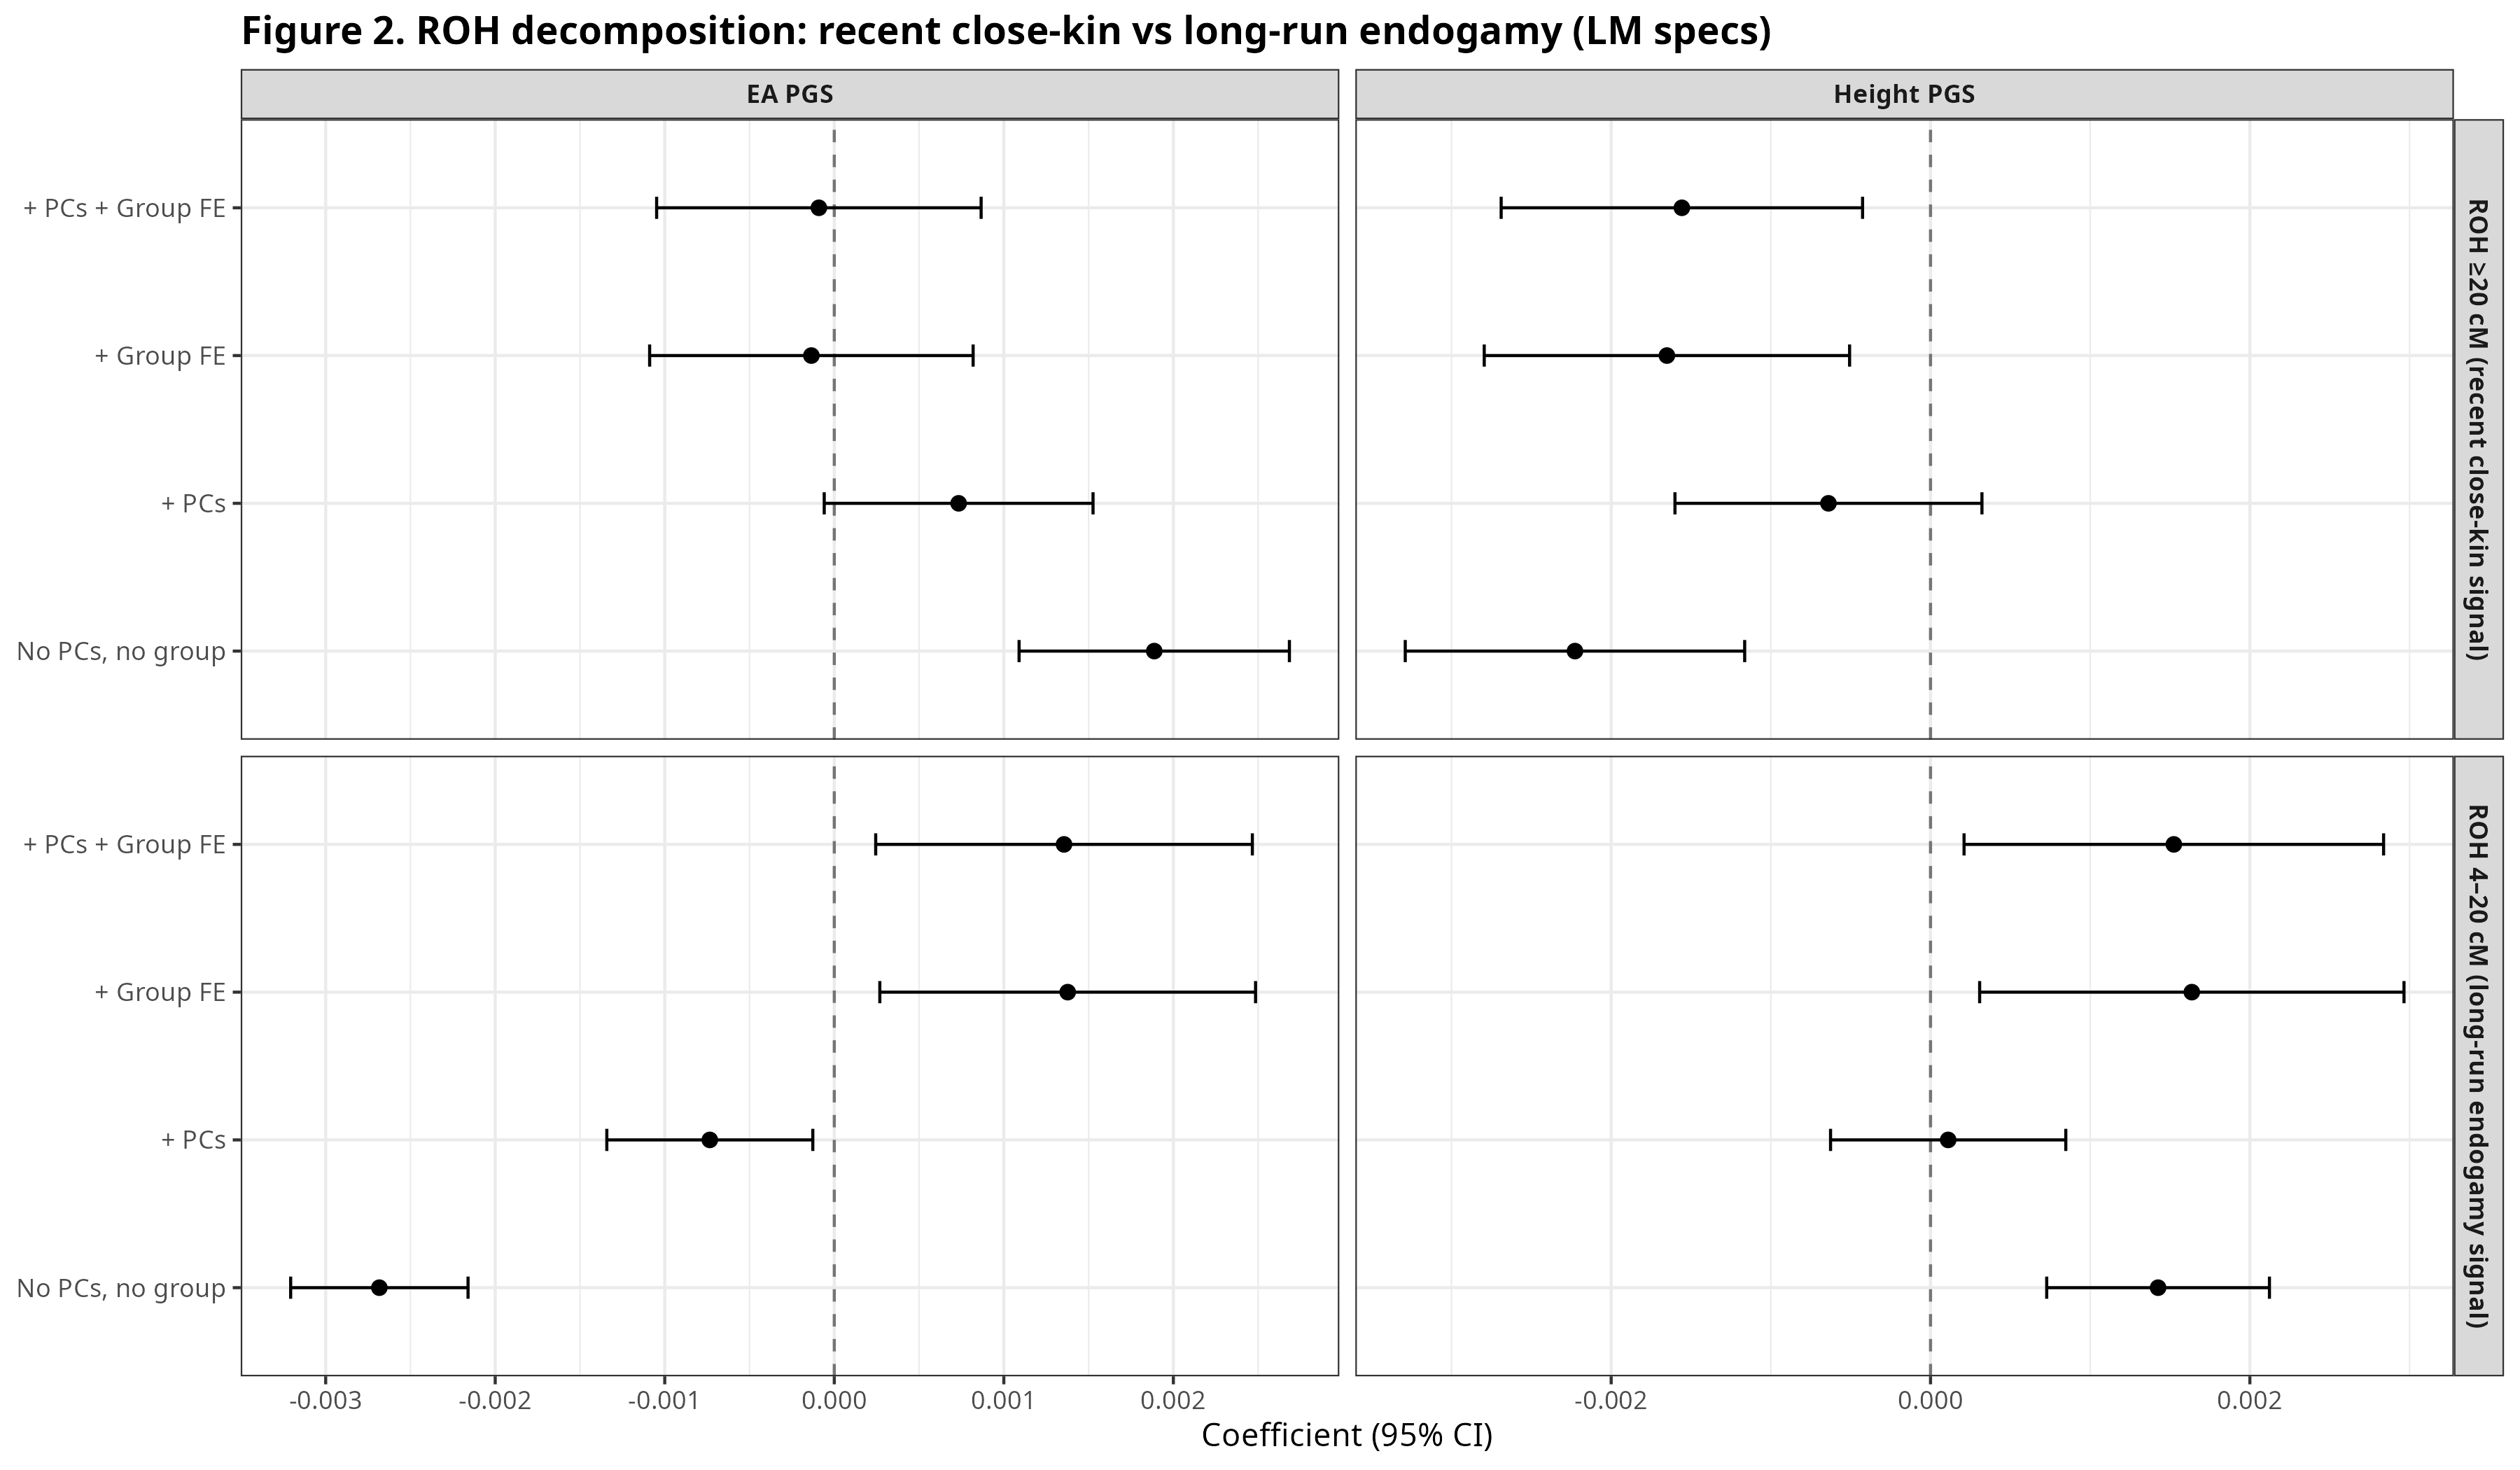
The two ROH bins show different associations. ROH ≥20 cM is often negatively associated with the scores, most clearly for Height once group structure is included. ROH 4–20 cM behaves differently. For EA, the 4–20 cM coefficient varies across specifications, suggesting that between-group and within-group variation are not aligned.
At this point, the key question is whether the 4–20 cM signal reflects differences between populations, or variation within populations once ancestry and group identity are held fixed. Resolving that distinction requires a different model and a different figure.
The rest of the post walks through that decomposition and shows where the signal actually comes from.