
How Aryan Are Indians?
Steppe ancestry, the Indus substrate, and why India has no single answer

Populations connected to the spread of Indo-Aryan languages contributed ancestry to South Asia.
The difficult questions are how much they contributed, when they arrived, and why the answer differs so sharply among Indian groups.
Ancient DNA now gives a fairly clear broad answer. Ancestry related to Middle and Late Bronze Age Steppe pastoralists entered northern South Asia after the mature Indus period, probably during the second millennium BCE. It became widespread, but it is not dominant in any of the published Modern Indian Cline groups analyzed here. In those data, it ranges from only a few percent to roughly one quarter.
There is no single Indian “Aryan percentage.” There is a gradient shaped by geography, language, endogamy and social history.
What Counts as “Aryan” Ancestry Here?
In this article, “Aryan ancestry” refers operationally to ancestry related to Central Steppe populations of the Middle-to-Late Bronze Age (MLBA): the eastern Steppe genetic cluster associated with populations such as Sintashta and related groups. Archaeology and historical linguistics make populations from this broader horizon plausible carriers of early Indo-Iranian languages, while genetics establishes the underlying movement and mixture (Narasimhan et al., 2019).
The Steppe source was itself an admixed population assembled on the Eurasian Steppe. “Steppe-related” therefore denotes statistical genetic affinity to sampled ancient reference populations.
India Before the Steppe
Before this Steppe ancestry arrived, the subcontinent already contained deeply divergent populations.
One ancestry layer is conventionally called AASI, or Ancient Ancestral South Indian. No unadmixed AASI genome has yet been sampled. It is a statistically reconstructed lineage, and present-day Andamanese hunter-gatherers are used as a distant proxy in some models. This does not mean that mainland Indians descend from a migration out of the Andaman Islands.
A second layer is Iranian-related ancestry. Here too the name is easy to misunderstand. It does not mean ancestry from modern Iranians, and it is not identical to the ancestry of the sampled early farmers of western Iran. The direct Harappan genome from Rakhigarhi carried substantial ancestry related to an ancient lineage connected to Iran, but that lineage had split before the sampled Iranian hunter-gatherers, herders and farmers differentiated (Shinde et al., 2019).
These two deep layers had already mixed before the Steppe-related movements. Eleven Bronze Age people from Gonur and Shahr-i-Sokhta formed what Narasimhan and colleagues called the Indus Periphery Cline. They were not excavated inside the Indus Valley Civilization (IVC), but archaeology and genetic modeling connect them to the IVC sphere. The single usable genome from an actual Harappan burial at Rakhigarhi fell on the same broad gradient and showed no detectable Steppe ancestry. One individual cannot represent every Harappan city or community, but it supplies a crucial pre-Steppe anchor.
Earlier modern-genome research summarized the main ancestry gradient as mixture between two statistically reconstructed endpoints: Ancestral North Indians (ANI) and Ancestral South Indians (ASI) (Reich et al., 2009). These were model-based ancestral populations, not ancient individuals sampled directly or present-day groups. Ancient DNA later clarified their composition. The ASI endpoint is an AASI-rich mixture: it combines Indus-related ancestry—which already contained AASI-related and Iranian-related ancestry—with ancestry from groups carrying still more AASI-related ancestry. The ANI endpoint is also composite, combining Indus-related and Steppe-related ancestry (Narasimhan et al., 2019). Put simply, AASI is a deep ancestry lineage and one ingredient in ASI, whereas ASI is a later, AASI-rich mixture.
When the Steppe Signal Appears
The ancient sequence is more informative than a modern ancestry map alone.
In the supplementary data reanalyzed here, 11 deduplicated Indus Periphery individuals have date midpoints spanning approximately 3175–2056 BCE. The Central Steppe MLBA source group spans approximately 2036–1100 BCE. The later South Asian rows comprise 85 individuals from archaeological sites in the Swat Valley—a mountain valley in present-day Khyber Pakhtunkhwa, northwestern Pakistan—assigned to the study’s main Late Bronze and Iron Age cluster (SPGT), plus two genetic outliers (SPGT_o), with date midpoints spanning approximately 1263–808 BCE.
Figure 1 places those groups and sites in both geographic and chronological context. Panel A shows where the named locations lie; Panel B shows when the analyzed individuals lived.
Figure 1. Ancient geography and chronology behind the South Asian Steppe signal.
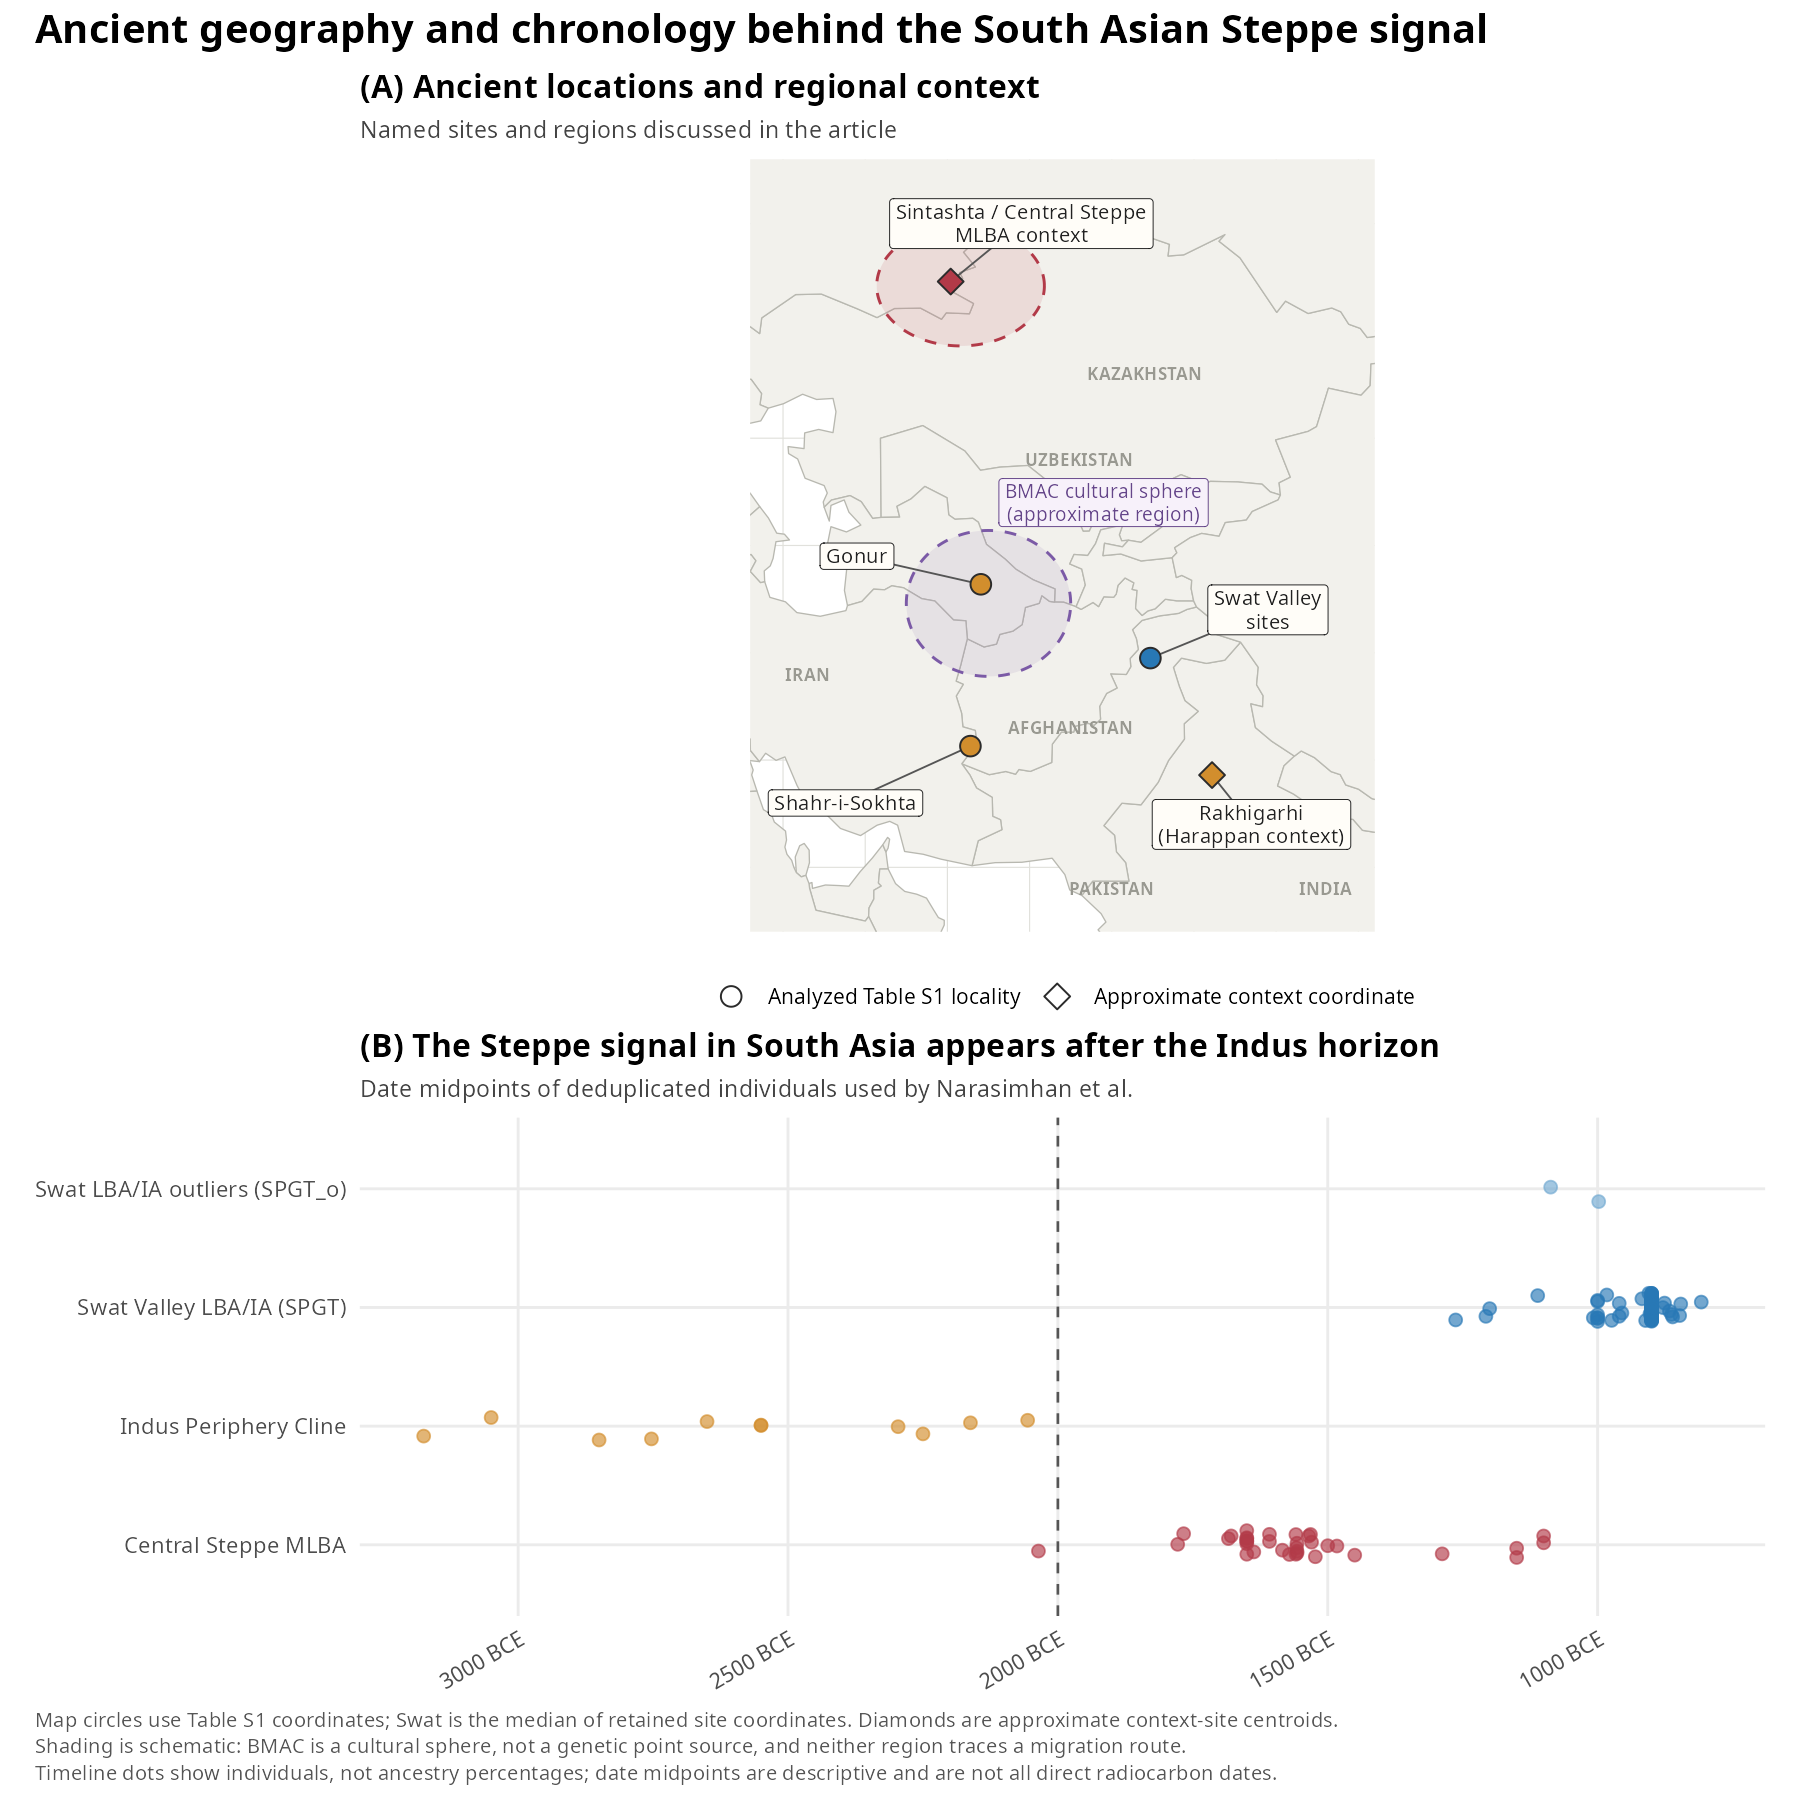
The sampled skeletons from Swat lived after the relevant gene flow began. In a separate analysis of 86 SPGT individuals, ancestry-covariance dating placed their Steppe-related mixture earlier, with an approximate interval of 1900–1500 BCE. Steppe ancestry also appears in outlying individuals in Central Asia before it becomes visible in the South Asian transect. Together, the chronology, geography and source matching support movement into South Asia during the second millennium BCE (Narasimhan et al., 2019).
Modern-genome linkage-disequilibrium estimates place major ANI–ASI-related mixture events roughly 1,900–4,200 years ago (Moorjani et al., 2013). Those dates do not independently date the first Steppe arrival: they average mixture between already complex ancestral populations, sometimes across more than one episode.
This is consistent with a route for Indo-Iranian languages, but it is not a genetic recording of speech. Nor does the evidence support treating the main population associated with the Bactria–Margiana Archaeological Complex (BMAC)—a Bronze Age urban cultural sphere centered in southern Central Asia—as the principal genetic source of present-day South Asians. BMAC lay along the relevant cultural corridor, but genetic and cultural transmission need not have identical sources (Narasimhan et al., 2019).
There Is No Single Indian Percentage
For the main modern comparison I reanalyzed the hierarchical qpAdm estimates published by Narasimhan and colleagues for 140 named groups on the Modern Indian Cline. My primary Indian subset contains 132 groups whose sampling location is an Indian state or union territory. Groups sampled in Pakistan, Nepal, Bangladesh, Myanmar, Iran or the United States were excluded from that primary subset, although they remain in the full South Asian figure and data table. All ranges, medians, maps and regressions in this section use those published hierarchical estimates; the separate Allen Ancient DNA Resource (AADR) reconstruction below is not appended to them.
The unit is a named sampled group—not an individual and not a population-weighted share of India.
Across all 140 cline groups, Central Steppe MLBA-related ancestry ranges from 2.7% to 27.4%, with an unweighted median of 10.9%. In the 132-group primary Indian subset, the range is 2.7% to 25.0% and the median is 10.3%.
Table 1 brings the main descriptive comparisons together: the full cline, the primary India subset, the two largest language families, and the workbook’s Brahmin/Bhumihar split. Each row summarizes named groups with equal weight.
Table 1. Unweighted Steppe-related ancestry summaries across named sampled groups. “Other label” means groups not marked Brahmin or Bhumihar in the source workbook; it is not a complete caste category.
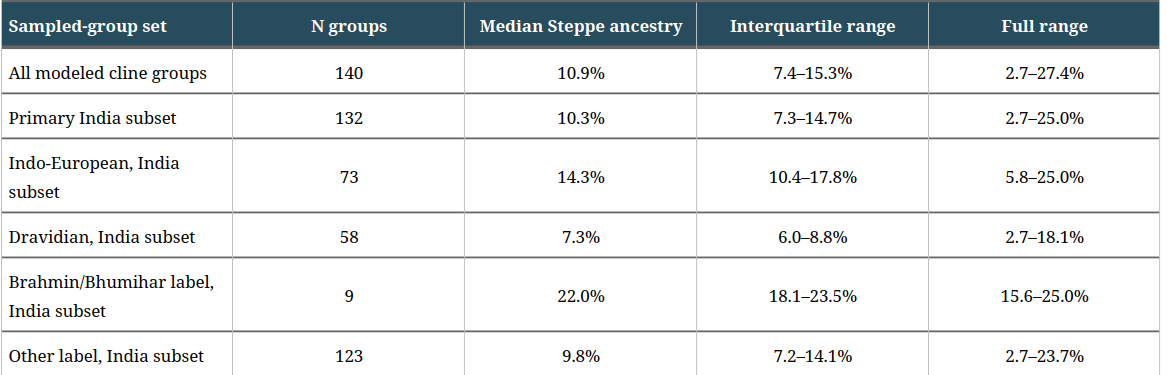
Those medians are useful descriptions of the sampled groups. They are not estimates that “the average Indian is 10% Aryan.” The underlying samples do not mirror India’s population sizes, and the modeled cline deliberately excludes several groups with substantial East Asian-related, Austroasiatic-related or other atypical ancestry.
The first visual comparison is geographic. A conventional heatmap would imply estimates for unsampled territory, but the 132 groups occupy only 104 source-table coordinates, with dense sampling in some areas and large gaps in others. Figure 2 therefore uses a point heat map: color represents the median among groups assigned to the same coordinate, point size records how many groups share it, and no ancestry surface is interpolated.
Figure 2. Point heat map of Steppe-related ancestry at sampled Indian locations.
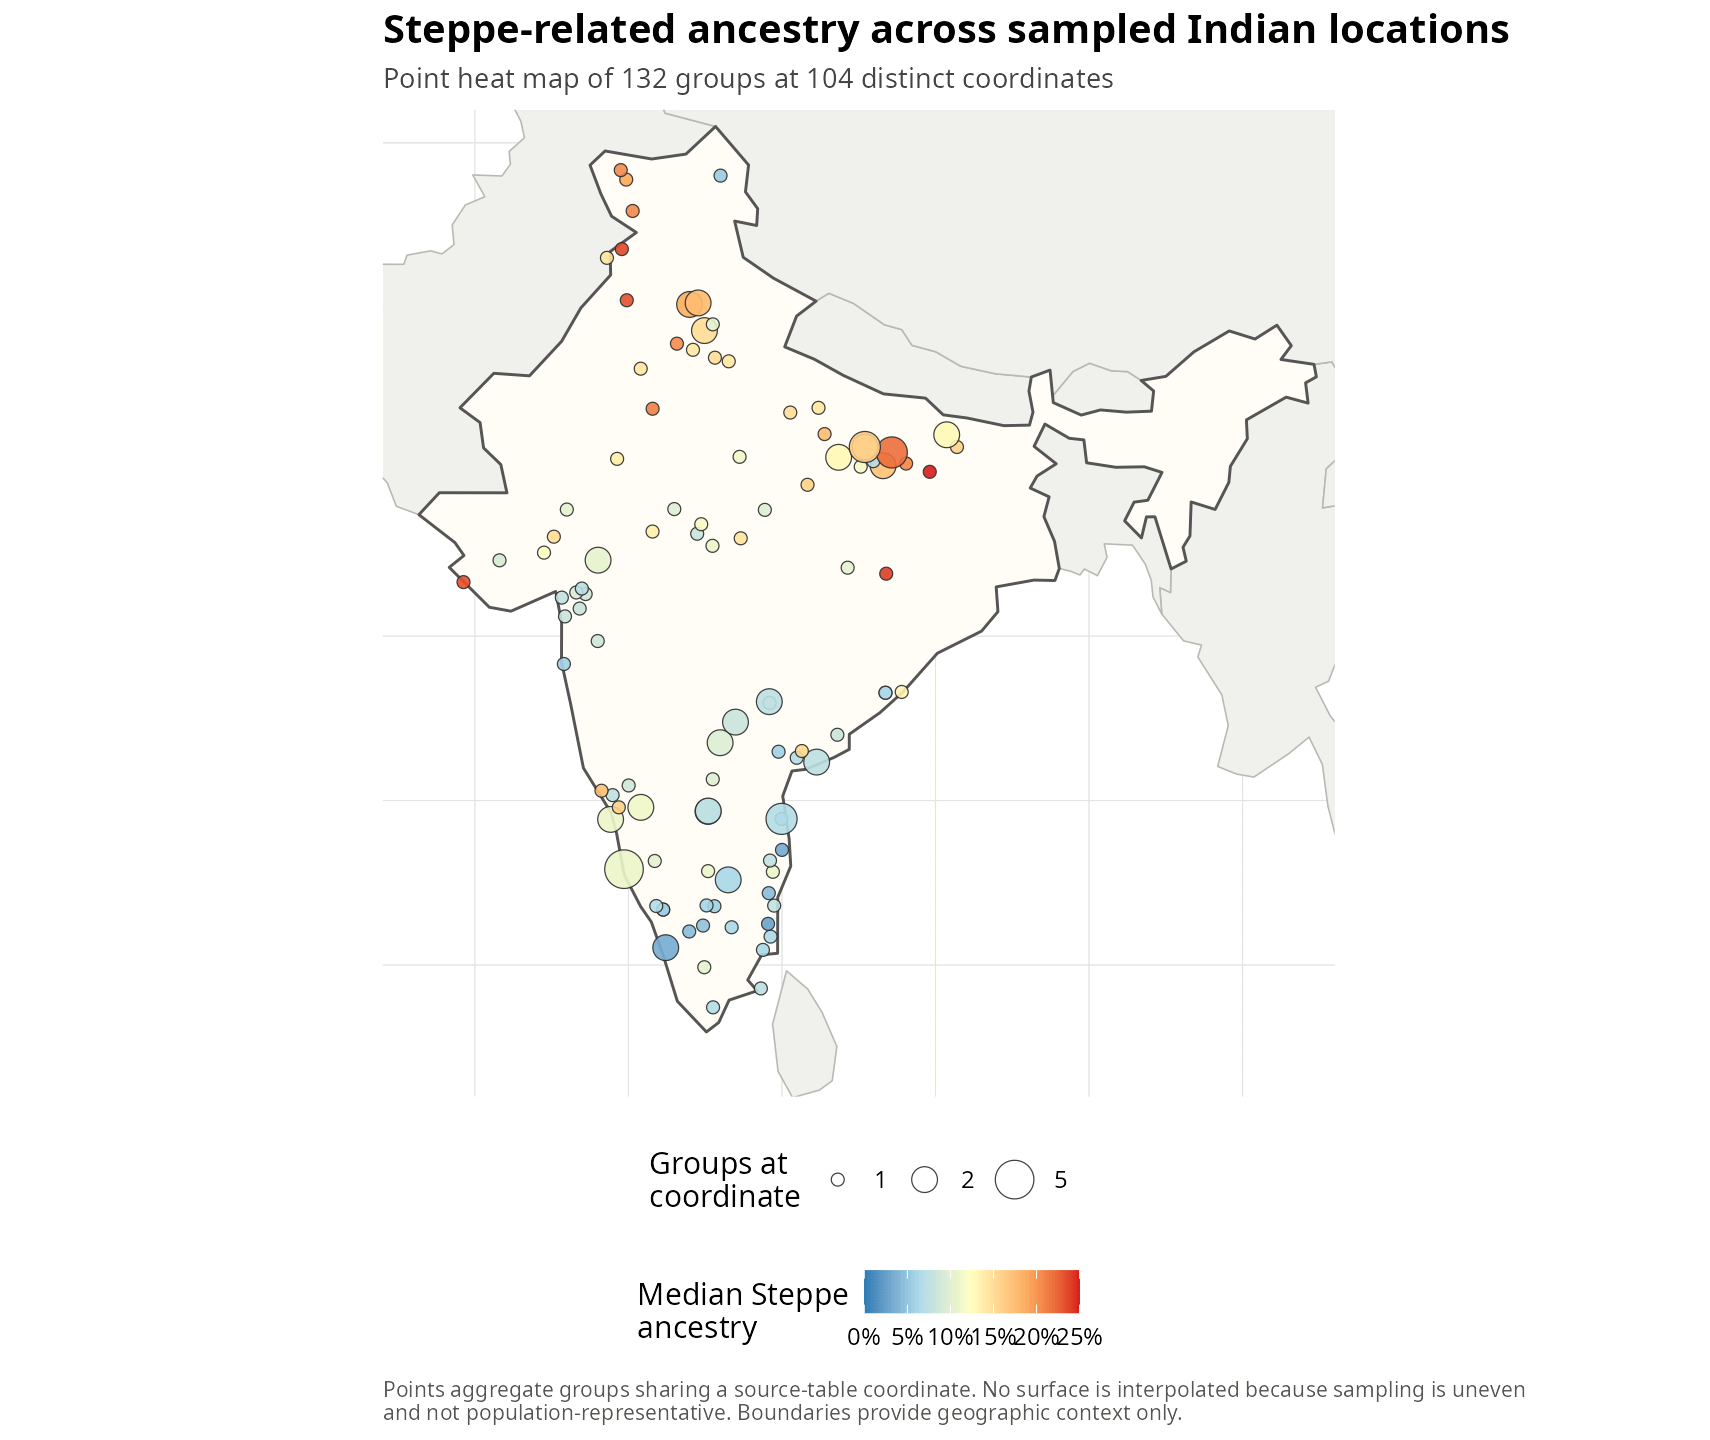
Even the lower end needs care. Eight southern Dravidian-speaking tribal groups could be modeled without Steppe ancestry in additional qpAdm tests reported by Narasimhan and colleagues. Their hierarchical point estimates in the main clinal model are slightly above zero because the joint model shrinks noisy group estimates toward the fitted gradient. A small positive point estimate is therefore not proof that every community received direct Steppe migrants.
The main result is not a national number but heterogeneity. The Steppe contribution is substantial in some northern and traditionally upper-status groups, modest across many other populations, and minimal or statistically unnecessary in some southern tribal groups. Across all 140 published cline point estimates, most ancestry nevertheless derives from older South Asian and Indus-related layers.
The map establishes the gradient. It does not tell us what drives it. Does the Indo-European–Dravidian difference survive once latitude and the Brahmin/Bhumihar label are considered together? Does the paternal signal tell the same story as autosomal ancestry? And can the published qpAdm pattern be recovered from AADR v66?
Below, I test those questions, compare autosomal and paternal signals, examine source-model sensitivity, and run a fresh qpAdm reconstruction. One of the apparent contrasts changes sharply after adjustment.