
How Genetically Homogeneous Are Europeans and East Asians – and Do They Form Separate Clusters?
Includes an interactive Fst app to play with all pairwise distances between European and East Asian populations.

If you drop a Spaniard in Seoul, most faces will blur together at first. To an untrained European eye, Koreans, Chinese and Japanese all look “kind of similar”. The reverse is also true: many Chinese people have trouble telling apart a Spaniard, an Italian and even a German on the street.
That everyday confusion is a pretty good informal description of what population geneticists call clusters.
In this post I take that fuzzy, everyday intuition and pin it down with numbers.
I focus on just Europe and East Asia for three reasons:
They are two of the best-sampled regions in human genetics, with lots of reference populations: British, Italians (North/Centre/South), Finns, Han North, Han South, Koreans, Japanese, Tibetans, and so on.
And, as we’ll see, they form two very clean clusters in Fst space: populations inside each region are much closer to each other than they are to any population in the other region.
Fst measures what share of the total genetic variation is due to differences between populations rather than variation within them.
An Fst of 0.10 means that about 10% of the genetic variance in allele frequencies (for the SNPs we’re looking at) is due to differences between populations, and about 90% is variation within populations.
Fst = 0 means all the variance is within populations: they are genetically indistinguishable in terms of allele frequencies.
Fst close to 1 (never seen in humans) would mean almost all variance is between populations: each group is fixed for different alleles.
Using genome-wide data, I compute all pairwise Fst values between these European and East Asian groups and feed them into a small interactive app I built. The app lets you:
pick any two populations and see their exact Fst,
browse the full distance matrix as a heatmap,
and see where each group sits on a world map.
The basic pattern is simple:
Within Europe: genetic distances are tiny
Within East Asia: still small, but clearly larger than within Europe
Between Europe and East Asia: roughly an order of magnitude larger
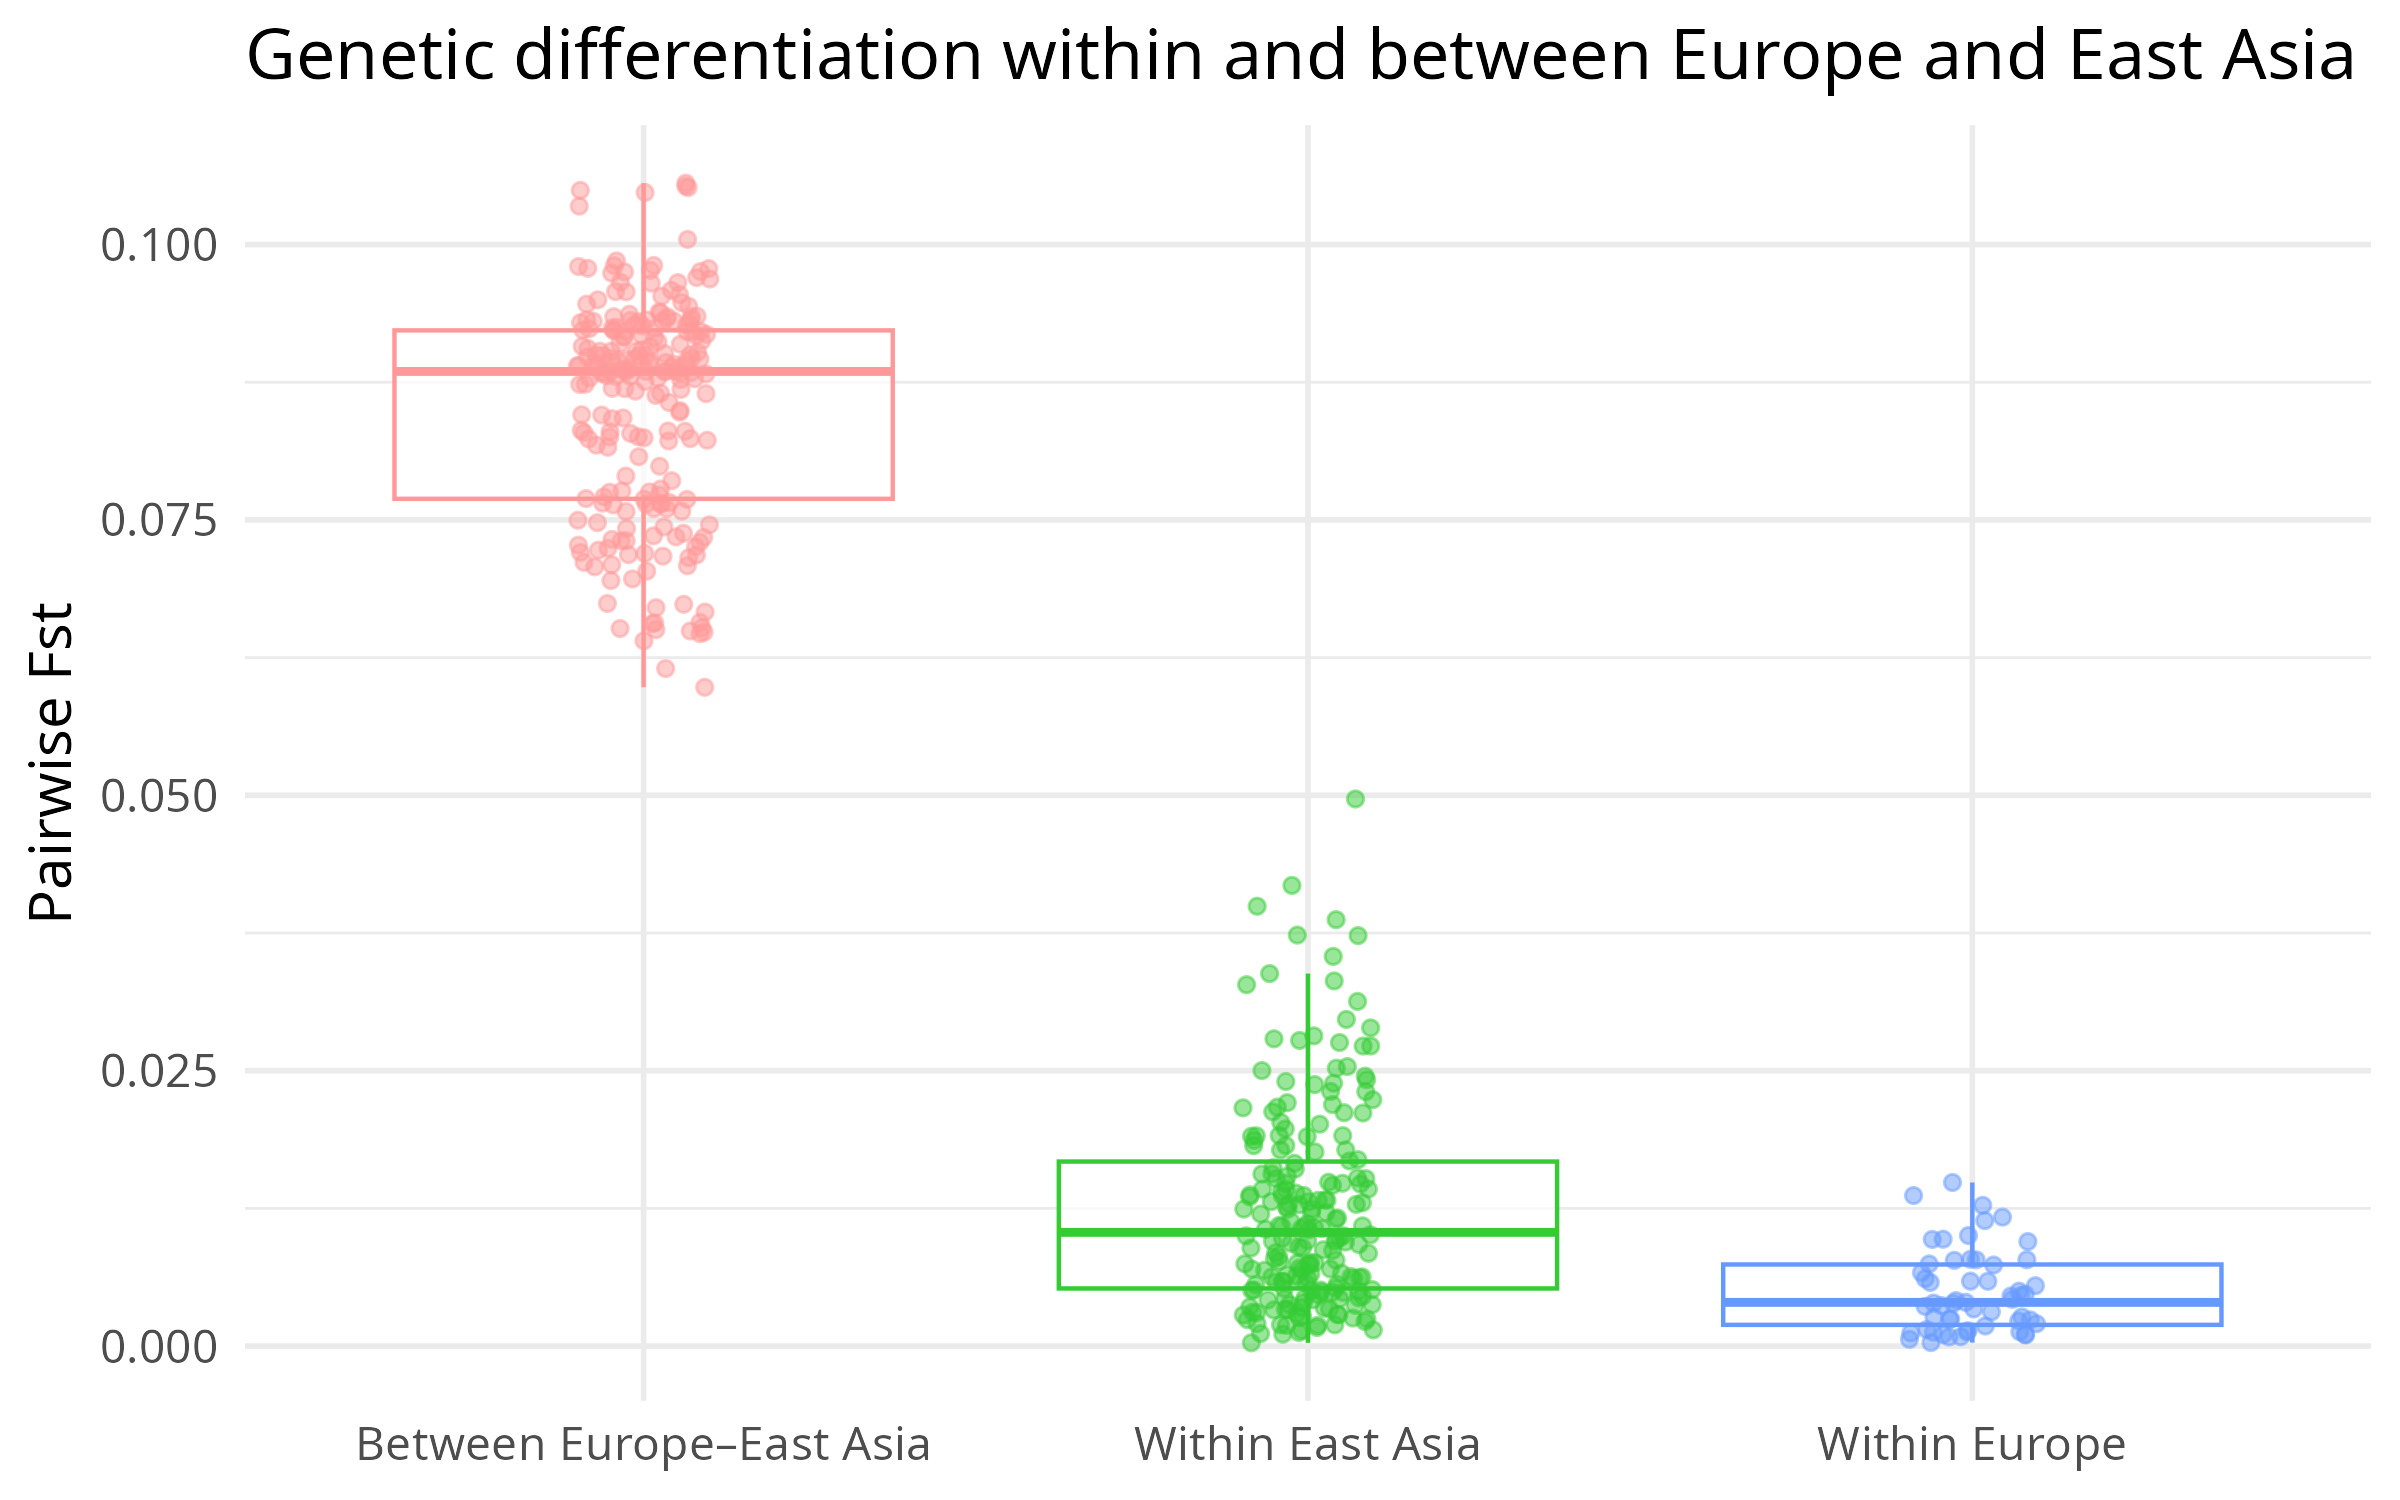
The boxplot below is generated directly from the app and summarises this visually:
Figure 1 – Pairwise Fst between European populations, between East Asian populations, and between Europe–East Asia.
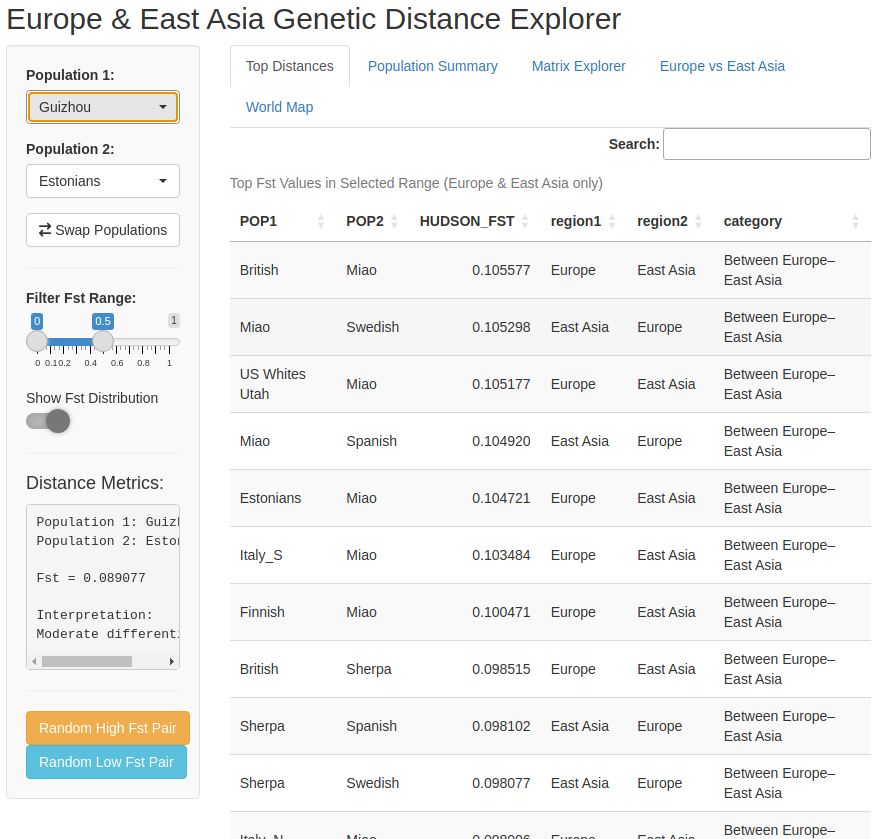
And this is what the main page of the app looks like:
Figure 2 – Screenshot of the Fst explorer app, with tabs for top distances, Fst distribution, the distance matrix heatmap, a Europe–East Asia comparison, and a world map of sampling locations.
In the next section I’ll make precise what I mean by a “cluster” in Fst space and show that, under a strict definition, Europe and East Asia really do behave like two separate genetic clusters. For paid subscribers, the app itself is available at the end of the article, so you can click around and test your own intuitions.
The boxplot tells the story at a glance, but here are the key numbers:
Within Europe
Mean Fst: 0.0049
Median: 0.0040
Range: 0.0003 – 0.0149
Lowest distance: British vs. US Whites Utah (0.0003)
Highest distance: Finnish vs. Greek (0.0149)
Within East Asia
Mean Fst: 0.0124
Median: 0.0103
Range: 0.0003 – 0.0497
Very tight clusters around the Han groups:
Han North vs. Hubei Han: 0.0003
Han North vs. Han South: 0.0011
Larger distances involve more peripheral groups, e.g. Miao vs. Sherpa: 0.0497
Between Europe and East Asia
Mean Fst: 0.0853
Median: 0.0885
Range: 0.0598 – 0.1056
Smallest Europe–East Asia distance: Greek vs. Nepal (0.0598)
Largest distances involve Miao vs. various Europeans, e.g. Miao vs. British: 0.1056
So, on average:
Europe–East Asia Fst is ~17× larger than within-Europe Fst
Europe–East Asia Fst is ~7× larger than within-East Asia Fst
In Wright’s classic (and somewhat arbitrary) rule-of-thumb, Fst below 0.05 indicates “little” differentiation, 0.05–0.15 “moderate”, and above 0.15 “great”. By that scale:
Within Europe sits at the extreme low end – well under 0.01 for most pairs
Within East Asia is still in the “little differentiation” zone, but clearly higher than Europe
Europe vs. East Asia falls in the middle of the “moderate differentiation” range
Europe: a very tight genetic cluster
The within-Europe distribution is extremely compressed. Many pairwise distances are around 0.003–0.005, and it is hard to push Fst above 0.01 unless you involve Finns, who are slightly more differentiated due to their partial Uralic ancestry and demographic history.
Some example distances:
British vs. Whites from Utah (US): 0.0003
Central Italy vs. Southern Italy: 0.0006
Italy_N vs. Spanish: 0.0010
Estonians vs. Greek: 0.0128
Finnish vs. Greek: 0.0149 (the maximum within-Europe pair in this dataset)
So even the most distant European pairs in this panel are still much closer than typical Europe–East Asia comparisons.
East Asia: more structure, but still compact
Within East Asia, mean Fst is higher (~0.012), but still relatively modest by global standards. There is a clear core cluster around Han North, Han South, and nearby groups:
Han North vs. Hubei Han: 0.0003
Han North vs. Han South: 0.0011
Han South vs. Hubei Han: 0.0012
Distances grow as you move towards more peripheral or high-altitude populations:
Maonan vs. Sherpa: 0.0418
Miao vs. Sherpa: 0.0497 (the maximum within-East Asia pair here)
So East Asia has visibly more internal structure than Europe, but it is still a single, fairly tight cluster compared to the gap separating it from Europe.
The Europe–East Asia gap
The between-continent Fst values mostly fall in the 0.08–0.10 range:
Greek vs. Nepal: 0.0598 (smallest Europe–East Asia Fst)
French vs. Han North: ~0.084
British vs. Vietnamese: 0.0895
British vs. Miao: 0.1056 (one of the largest values)
In other words, the typical Europe–East Asia genetic distance is an order of magnitude larger than the distances inside each region. That’s exactly what you’d expect after tens of thousands of years of limited gene flow across the breadth of Eurasia, with most mixing happening locally rather than across continents.
A definition of “cluster”
So far I’ve been showing distributions of pairwise Fst within Europe, within East Asia, and between the two. Intuitively, Europe and East Asia look like two separate blobs in Fst space: distances inside each region are small, distances across regions are much larger.
To make that precise, I’ll introduce a very simple and very strict definition of a cluster based on Fst. This is a convenient working definition for this post: it captures exactly the idea of “cleanly separated” groups that the plots suggest.
A set of populations forms a cluster if the most distant pair inside the set is still more similar than the closest pair between the set and any population outside it.
In plain language:
Look at all within-cluster pairs → find the largest Fst among them.
Look at all between-cluster and outside pairs → find the smallest Fst among those.
If the largest “within” distance is still smaller than the smallest “between” distance, you have a cleanly separated cluster.
Formally, let Fst(i,j) be the pairwise Fst between populations i and j, and let C be a set of populations (for example, all the European groups). Then C is a cluster if

In other words, the largest distance inside the cluster is still smaller than the smallest distance from the cluster to any outsider. This guarantees a genuine gap between “within” and “between”, not just a difference in averages.
Under this definition, Europe and East Asia really do form two distinct clusters in Fst space:
The most distant European pair in this dataset has Fst ≈ 0.015.
The most distant East Asian pair has Fst ≈ 0.050.
The closest Europe–East Asia pair has Fst ≈ 0.060.
So:
Even the most divergent Europeans are still closer to each other than the closest Europe–East Asia pair.
The same is true for East Asia: even the most divergent East Asian populations are closer to each other than any of them is to a European population.
By this strict criterion, Europe and East Asia aren’t just “somewhat different on average”. They form two well-separated genetic clusters: all the within-region distances sit on one side of the gap, and all the between-region distances sit on the other.
If you want to explore this yourself, I built a small interactive app: you can click any two populations, see their exact Fst, browse the full distance matrix as a heatmap, and see where each group sits on a world map.
The app, together with the full distance matrix, is available below for paid subscribers.
