
Is Gusev right about Family GWAS? Signal-maxxing using cross-population LD

One of the recurring frustrations in genetics is that the designs we trust most are often the ones that leave us with the weakest-looking polygenic scores. The tension starts with the difference between standard population GWAS and family GWAS.
A standard GWAS compares unrelated people. That gives you a lot of power, but it also means the estimated allelic effects can absorb more than just direct biology: ancestry structure, geography, family environment, assortative mating, and indirect parental effects can all creep in if they are not perfectly controlled. Those problems become especially uncomfortable when the goal is to compare scores across populations, because even a subtle residual bias can masquerade as a striking genetic pattern.
That is one reason critics of cross-population PGS comparisons, including Gusev, have argued that family-based results showing weak or non-significant population differences should make us skeptical of using these scores to predict phenotypic differences across populations. Put more bluntly, his argument is that once you move from standard population GWAS to family or direct-effect GWAS, the dramatic between-ancestry differences largely evaporate or even reorder, which suggests that much of the original signal was stratification rather than real genetic causation. He states the position very starkly: “cross-population PGS comparisons have no theoretical basis whatsoever,” and he also argues that family-GWAS analyses of IQ produce very different group rankings from population-GWAS-based scores. In a Substack essay he similarly warns that the score mean in an external population can become an “arbitrary sum of predictive signal, noise, and bias.” He made the family-GWAS objection more explicit in a comment to one my earlier posts.
But what is a family GWAS? It asks a cleaner question: within families, when siblings differ in the alleles they happened to inherit, do they also differ in the trait? That within-family comparison strips away much of the shared background and gets us closer to direct genetic effects, but the price is lower power.
I started from the recent family GWAS paper by Guan and colleagues, which is interesting not just because it is family-based, but because it proposes a more general design for family GWAS that aims to be both more powerful and more robust than the usual within-sib setup. In other words, the Guan et al. framework is trying to keep the causal cleanliness of family designs while recovering some of the information that simpler family models leave on the table.
Once I took the direct-effect summary statistics and applied a conventional clump-and-threshold screen at p < 5e-8, almost nothing was left. Height retained 46 clumped SNPs, cognitive performance retained just 1, and educational attainment, hourly income, and household income retained 0. So the question became: if the signal is real but too diffuse to survive a brutally strict threshold, is there another way to pull it out?
The signal I am trying to recover here is not ordinary within-population predictive accuracy. It is a cross-population polygenic selection or adaptation signal: the possibility that populations differ, at least in part, because trait-increasing and trait-decreasing alleles have been pushed systematically up or down in frequency over time. That is why the filter is built from cross-population frequency structure. Cross-population LD is not a new term here; I am using it in the established sense of coordinated allele-frequency differences across populations, so that alleles at different loci do not move independently. If there is a real directional adaptation signal in the family-GWAS effects, then alleles with the same sign of phenotypic effect should not move independently across populations; they should show some coordinated frequency movement in the same broad direction.
The schematic below illustrates the intuition. If there is no coordinated cross-population signal, different SNP subsets will point in different directions. If there is a real adaptation-like signal, trait-increasing alleles should cluster together across populations, and trait-decreasing alleles should cluster together in the opposite direction.
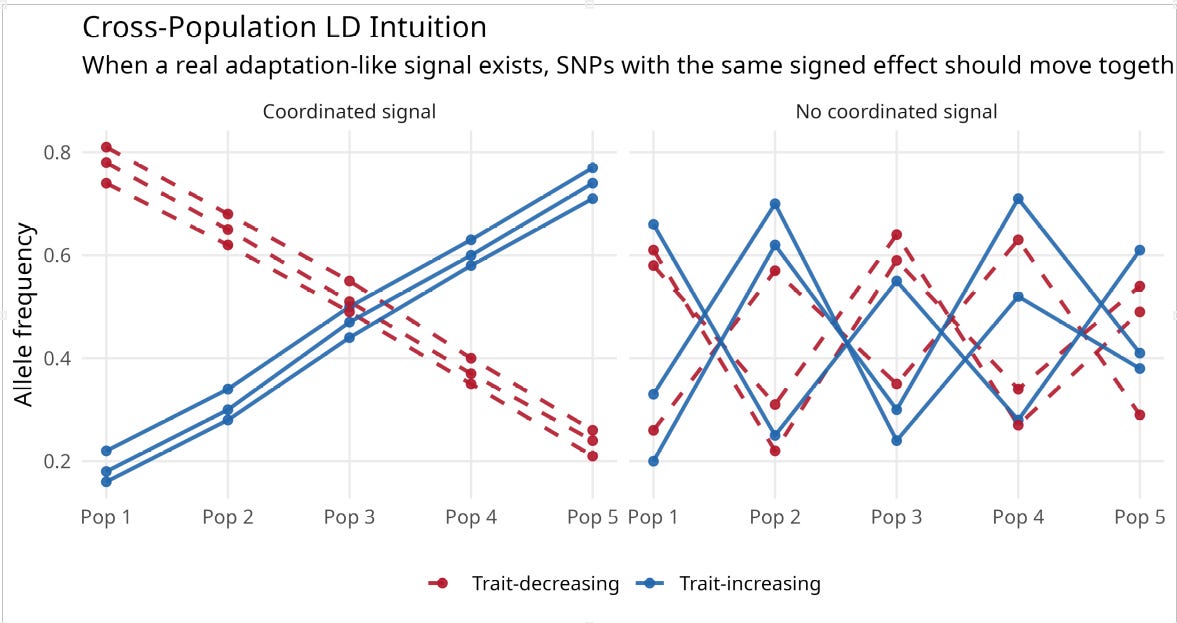
That kind of coordinated movement ought to show up as higher split-half reliability across SNP subsets, which is closely related in spirit to the cross-population logic behind Berg and Coop’s Qx framework. Separately, I also use a method-of-correlated-vectors style check: if the scores that look more internally coherent are also the ones that line up better with the external phenotype, that is at least suggestive evidence that reliability is tracking real signal rather than noise. The hope is that reliability can help separate coherent polygenic signal from low-power noise.
Main Results
The validation step here follows a familiar logic from the polygenic-selection literature: if a polygenic score is really capturing a cross-population genetic signal, one way to probe that is to ask whether it correlates with average population phenotypes, as in earlier work by Piffer and by Berg and Coop.
For each trait, I computed average PGS across a broad 50-population panel assembled from 1000 Genomes and gnomAD together with additional public reference datasets, including Denmark MAC5, EgyptWGS, TaiwanBB, SWEGEN, 1KG Poland, and HGDP Papuan. The phenotype correlations then use the overlapping populations for which the relevant external phenotype is available, so the IQ-linked analyses and factor analyses are based on the matched phenotype subset rather than all 50 populations, and the height regressions use the smaller subset with Height plus HDI or protein data.
When I used split-half reliability to prune the scores, the cognitive, educational, and socioeconomic PGS all became much more predictive across populations.
Educational attainment rose from r = 0.264 to r = 0.806 against IQ, household income from 0.378 to 0.701, hourly income from essentially zero to 0.579, and cognitive performance from 0.413 to 0.623. Across the ten trait-method combinations, the meta-correlation between phenotype association strength and split-half reliability was 0.680. And when I factor-analysed the four IQ-linked scores, the raw common factor was basically uninformative, whereas the optimized factor correlated r = 0.700 with IQ.
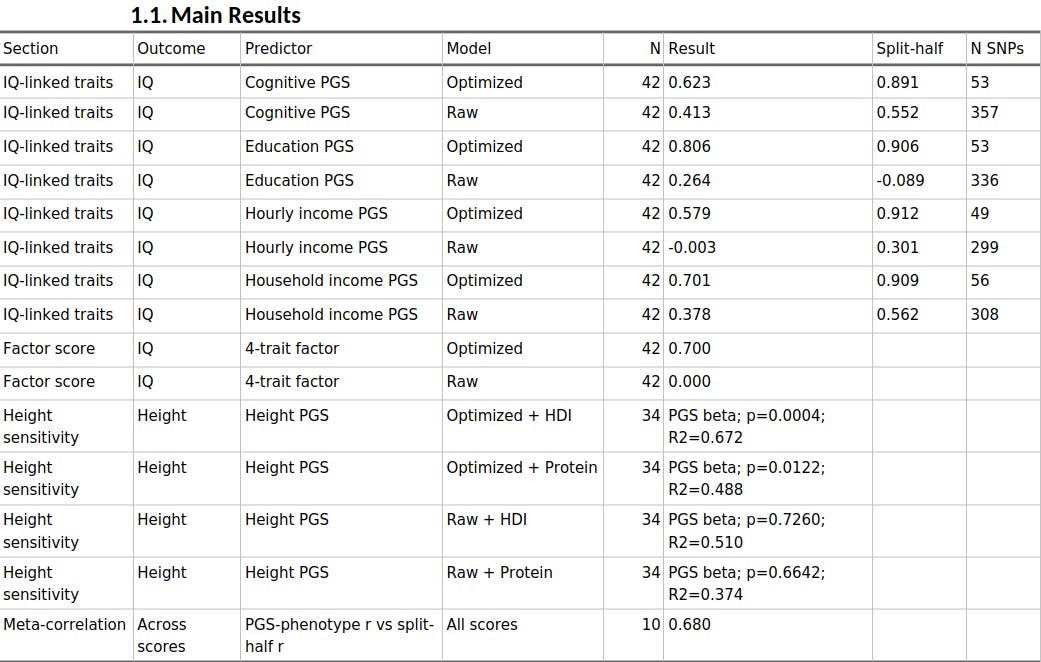
Height was the exception, and that turns out to be informative too. On its own, the height score did not line up well with observed height across populations. But once I treated height as the environmentally sensitive trait it obviously is, the pattern changed: the optimized height PGS became predictive after adjusting separately for HDI or protein availability, whereas the raw height PGS remained unconvincing. So the broad picture is not that reliability magically fixes every trait in the same way. It is that reliability seems to sharpen the latent signal, while the final interpretation still depends on the biology and the confounding structure of the phenotype.
The optimization itself was simple in spirit: start with the liberal score, then keep throwing away the SNPs that make the score less internally coherent across populations. Here split-half reliability just means the following. Take the SNPs in a score, split them into two random halves, compute the population score from the first half and from the second half, and then ask whether populations that rank high on one half also rank high on the other. If the two halves keep telling a similar story, the score is internally coherent; if they disagree, the score is mostly noise. I repeated that random split many times and averaged the result, so the reliability estimate is not driven by one lucky partition.
Below the paywall, I show how the method works in practice: the correlation heatmaps, the height sensitivity analyses, the raw-vs-optimized factor structure, and the exact greedy SNP-selection procedure used to recover signal from a low-powered family GWAS.
