
Italy’s North–South divide: what genome-wide similarity misses

From classic population-genetics maps to today’s memes, the same point is hard to miss: Italy has a persistent North–South divide. You see it in the usual region-shaded maps of socioeconomic outcomes too, from income and education to health and crime.
At the phenotypic level, it is familiar. Northern Italians are on average taller, southern Italians are on average darker in pigmentation, and educational outcomes often follow the same geographic gradient.
The confusion starts when people switch from phenotypes to genetics. If you run a principal component analysis (PCA) on Europeans, North and South Italians separate, but they still sit in the same part of the European space. The gap is not huge, but it is not negligible either: it is on the order of what you often see between neighboring European countries. So the naive reaction is: if they are genetically close, how can these gradients be real or persistent?
The problem is a conflation of genome-wide relatedness with trait-specific differentiation. PCA measures genome-wide relatedness dominated by processes that are approximately neutral with respect to fitness, reflecting drift, long-run admixture proportions, and demographic history averaged over the genome. It is an excellent summary of overall ancestry similarity, but it is not designed to isolate differences concentrated in subsets of loci tied to particular traits.
Polygenic scores capture something different. They are not a measure of overall distance, but of allele-frequency differences weighted by trait effects. Populations can be close on PCA and still differ in the trait-weighted direction, because selection and geographic sorting can act on trait-associated variants more than on the genome-wide average.
Below I show exactly that in Italy. First, a European PCA to establish that North and South Italy are distinct but close. Next I take three traits whose averages show clear North–South gradients in Italy, and test whether the corresponding polygenic scores recapitulate those gradients: Height, Educational Attainment, and Skin pigmentation.
Europe on a PCA
On a standard European PCA, Northern and Southern Italians are clearly distinguishable, but also close. Central Italy sits between them, as expected. The distances involved are modest compared with Italy versus Finns or Middle Easterners. However, Northern Italy is closer to Northwestern Europe, and partially overlapping with Spain.
Figure 1. PCA of European populations with Italy highlighted.
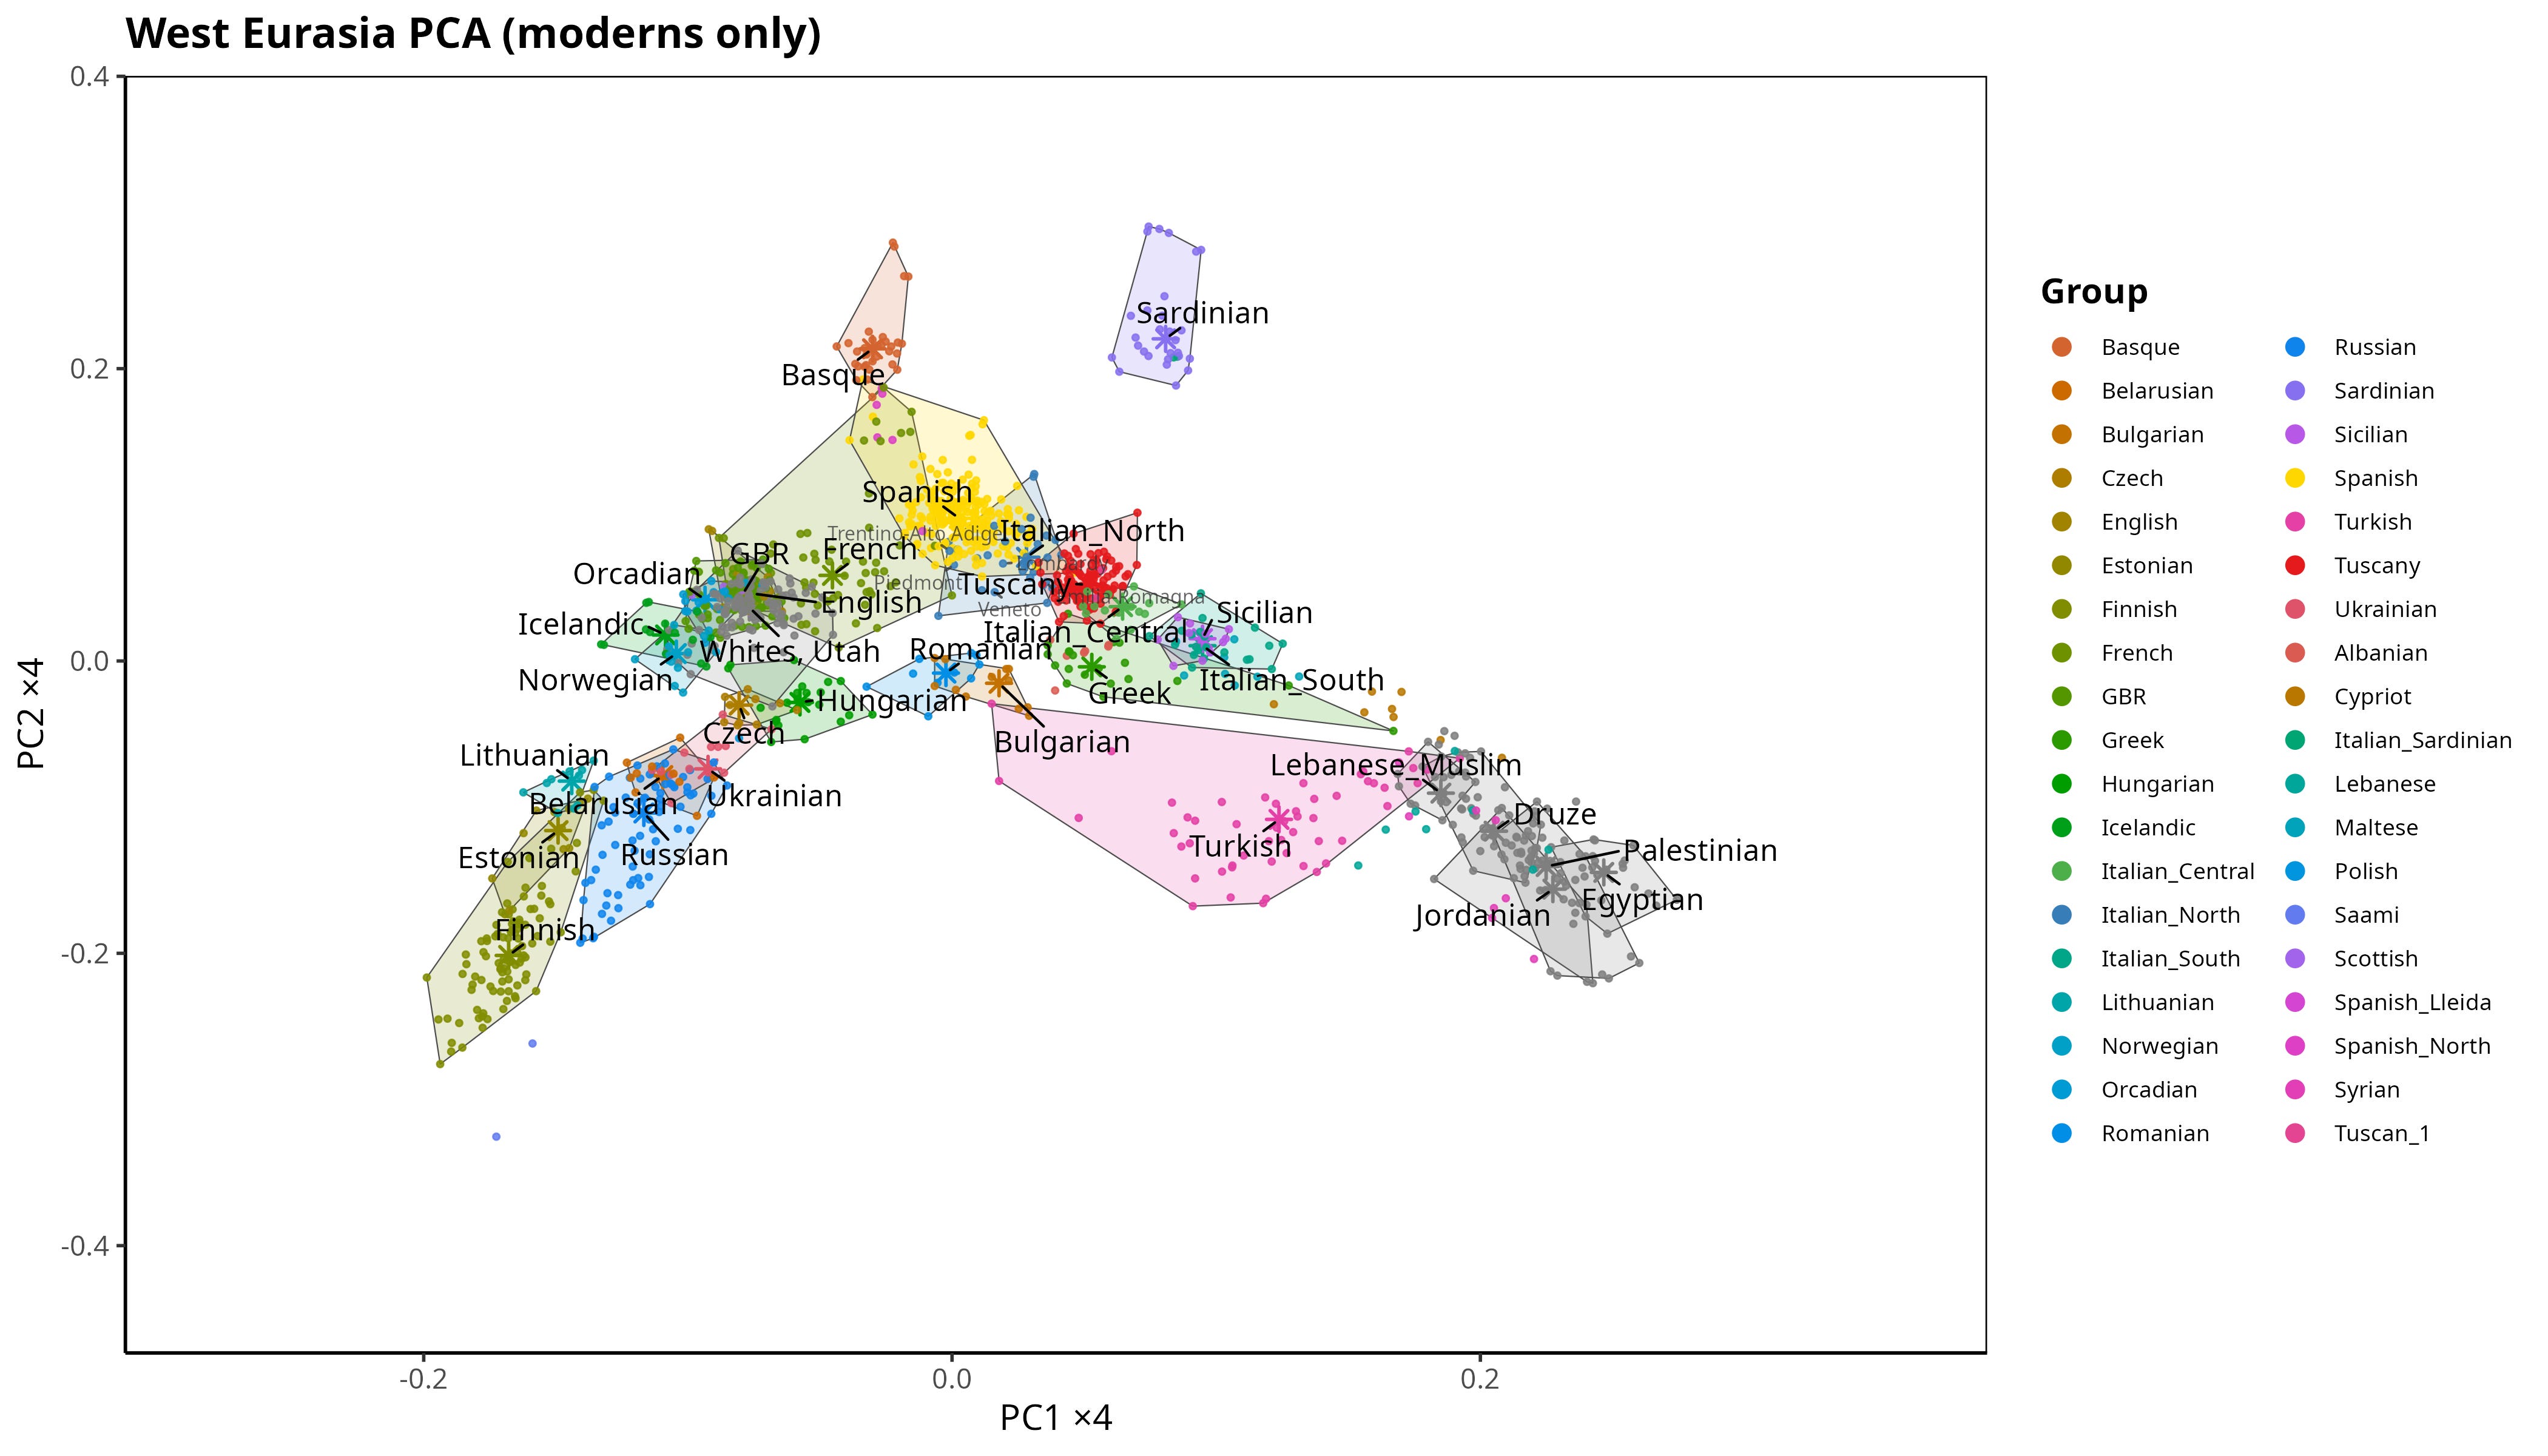
PCA is useful here because it captures genome-wide relatedness, the kind shaped by drift and broad demographic history.
The Fst distance between Northern and Southern Italy is also extremely small, around 0.0013. By comparison, British–Northern Italian Fst is roughly twice as large (≈0.0026), and Italian–Han Chinese Fst is nearly two orders of magnitude larger (≈0.088).
So the North–South split in Italy is real, but subtle in ancestry terms. It does not reflect a large between-population divergence.
That is where polygenic scores become informative.
What PCA measures, and what it does not
PCA mostly tracks genome-wide allele frequency differences that are dominated by demographic history and drift. Selection at particular traits can be present, but its signal is usually diluted when you average over the whole genome.
Polygenic scores focus on a restricted set of variants and weight them by trait effect sizes. That makes them sensitive to small, coordinated allele-frequency shifts at trait-associated loci. Those shifts can exist even when overall genome-wide differentiation is small.
Italy is a useful case because the genome-wide North–South split is limited, yet the trait gradients are well documented at the phenotypic level. The question is whether the corresponding PGS means line up with those phenotypic gradients.
Three traits, one gradient
I computed polygenic scores for three traits with well-known North–South gradients in Italy:
Height
Educational attainment (EA4)
Skin pigmentation
Polygenic scores were computed from clumped GWAS summary statistics: height (Yengo et al., 2022), educational attainment EA4 (Okbay et al., 2022), and skin pigmentation (Karczewski et al., 2025). Individual allele frequencies were merged to the GWAS SNP list, with explicit allele matching so the effect allele aligned correctly.
Given the documented North–South gradients in these traits, the expectation is that the corresponding polygenic scores should show the same rank across regions.
Height
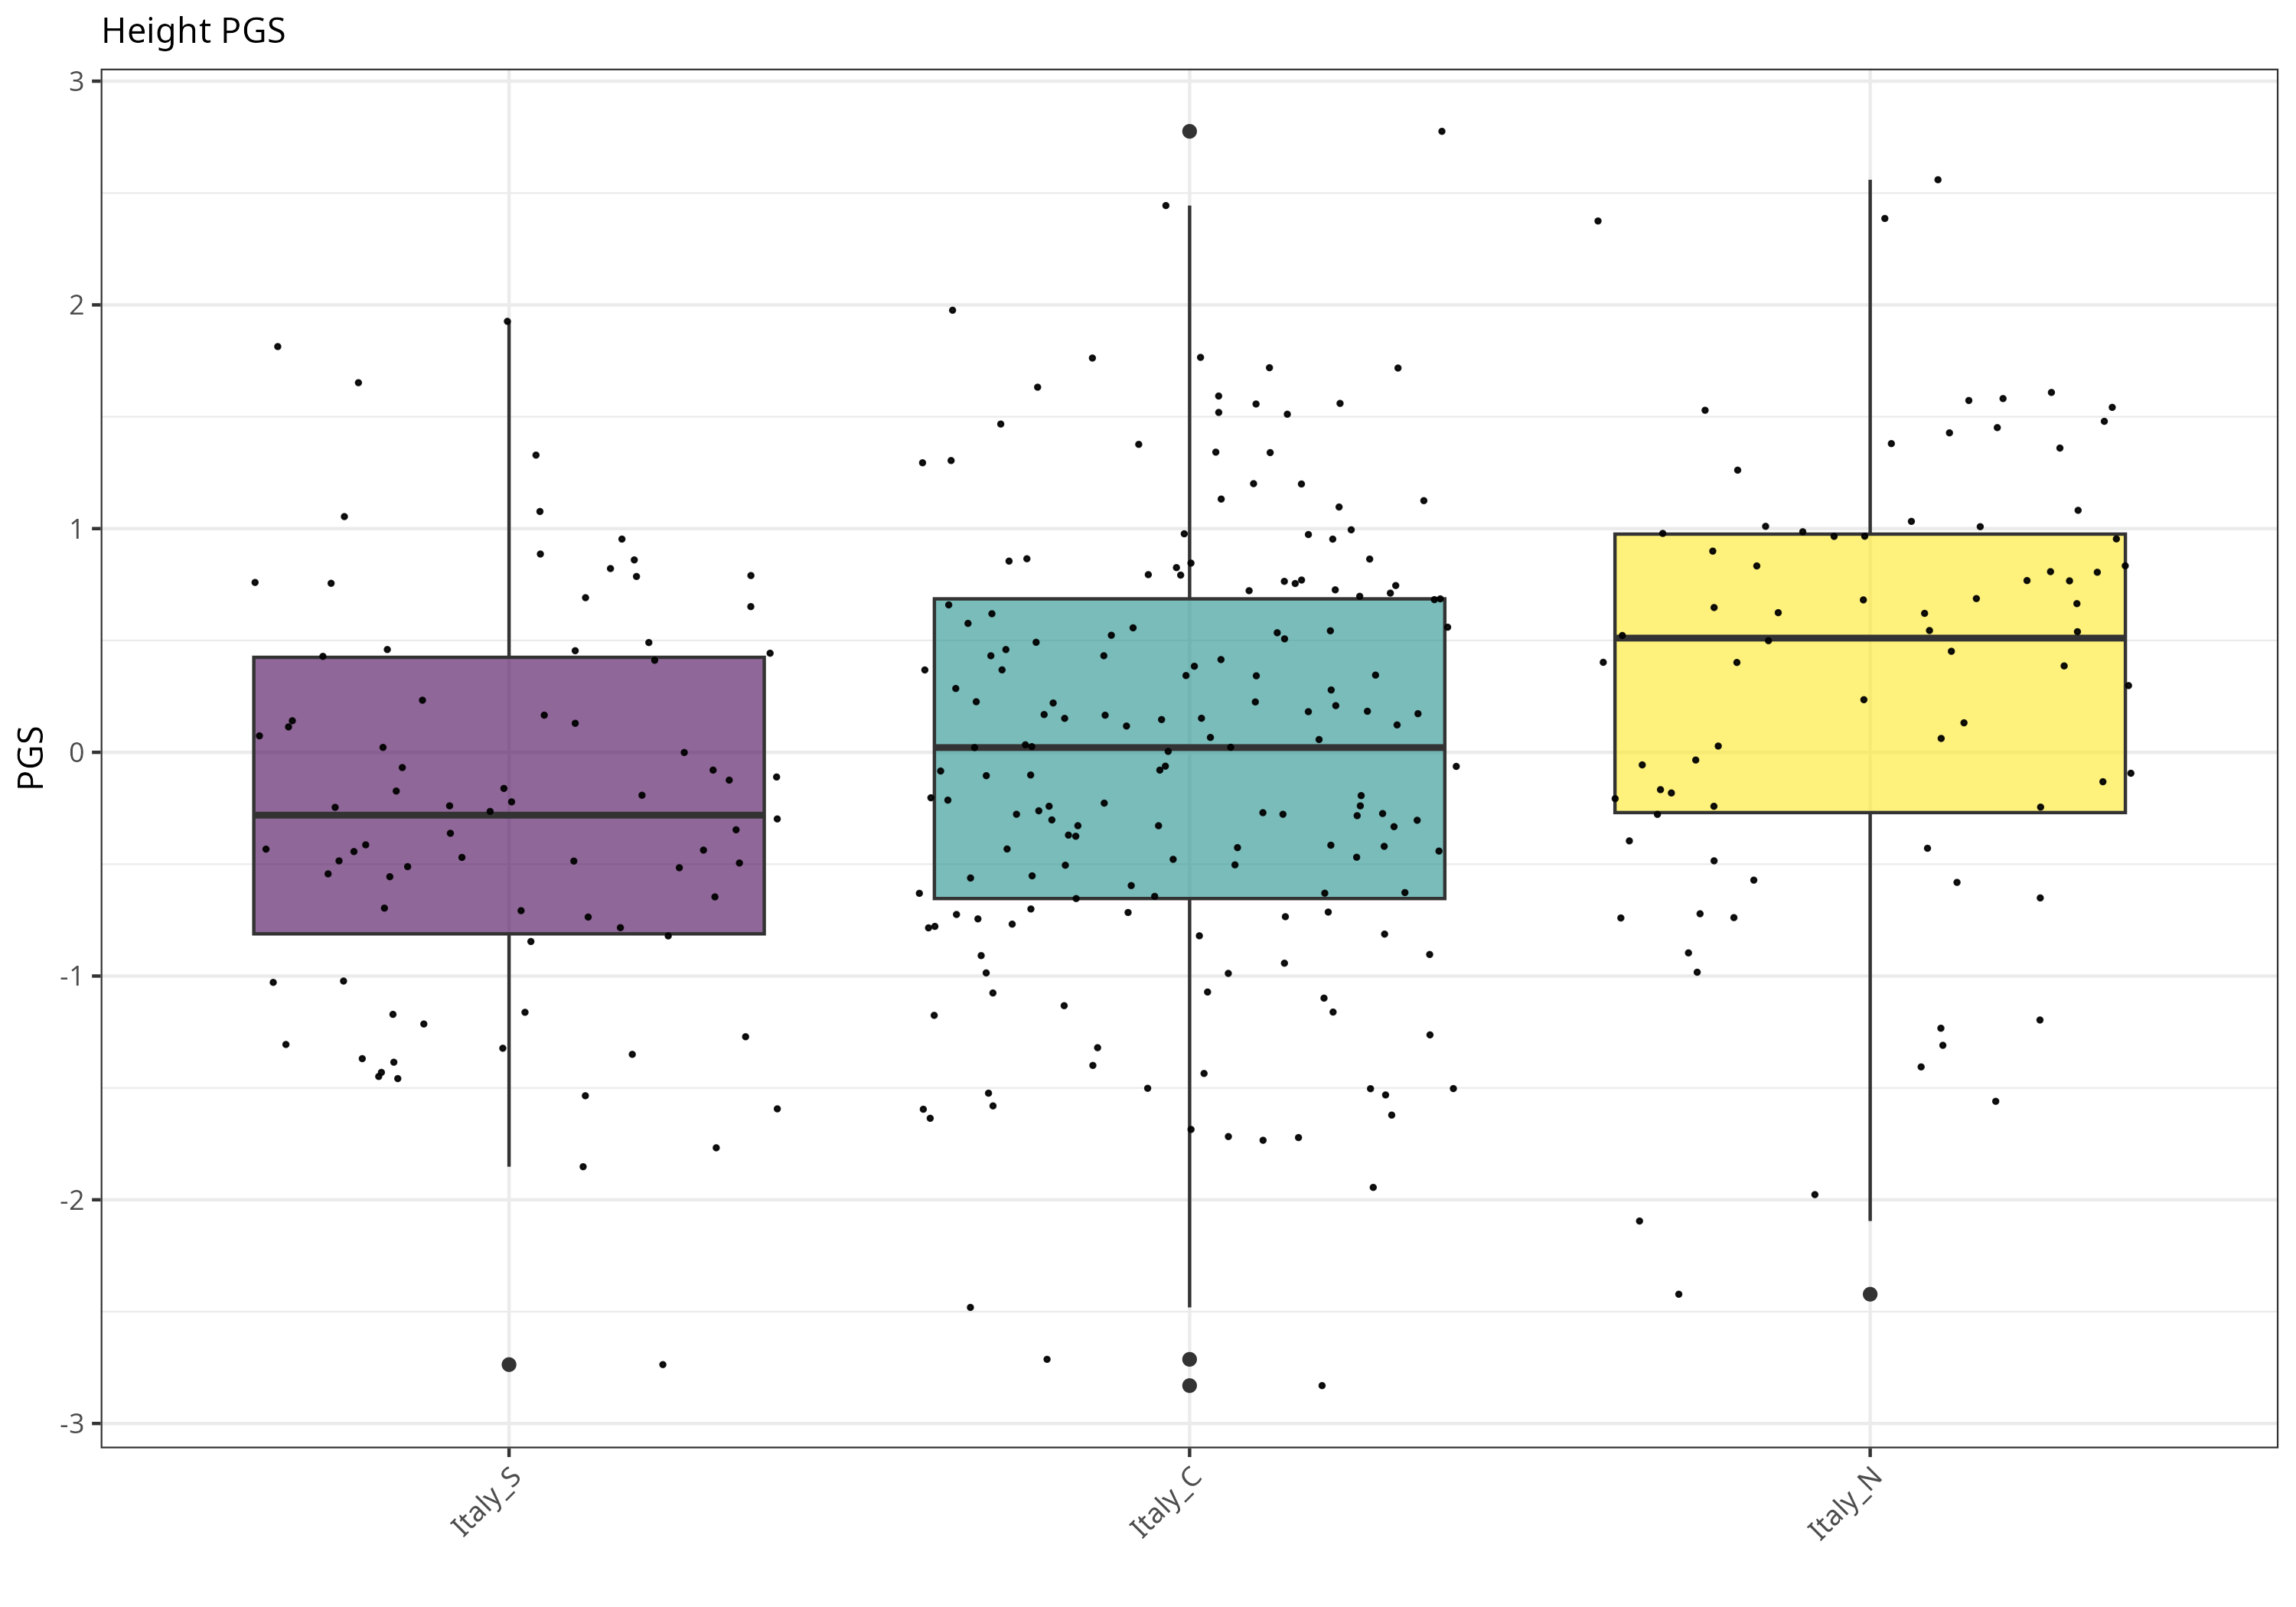
Height PGS differs across the three regions. The main separation is North versus South: Italy_N is higher than Italy_S (Tukey p< 0.001), and also slightly higher than Italy_C (p = 0.033). Center and South are not cleanly separable here (p = 0.178). Overall the regional effect is significant (ANOVA F(2,330) = 6.83, p = 0.001), with a moderate North–South gap (Hedges g ≈ 0.59).
Figure 2. Height polygenic score across Italian regions.
The remaining results extend this comparison to pigmentation and educational attainment, and discuss why trait-weighted genetic differences can be informative even when genome-wide distances are small.