
Mapping Human Genetic Diversity: A New Interactive Tool for Exploring Population Differences

Human genetic diversity tells the story of our species' journey across the globe. From the first migrations out of Africa to the isolated populations of remote islands, our DNA carries the signatures of thousands of years of human history. Today, I'm excited to share an interactive tool that makes this complex genetic landscape accessible to everyone—allowing you to explore the genetic relationships between over 100 human populations with just a few clicks.
Try the free version with 10 populations here →
In this article, I will introduce the concept of population differentiation, explain the work that went into building this tool, and show you how to use the interactive interface to explore human genetic diversity.
The link to the full version with 116 populations is available to paid subscribers only and can be found at the end of the article. Upgrade to paid now to enjoy the full experience!
What is Fst? Understanding Genetic Distance
At the heart of population genetics lies a powerful metric called Fst (pronounced "F-sub-st"), which measures genetic differentiation between populations. Think of Fst as a genetic "distance meter" that tells us how genetically distinct two populations are from each other.
The Science Behind Fst
Fst was originally developed by population geneticist Sewall Wright in the 1940s as part of his F-statistics framework. The metric ranges from 0 to 1:
Fst = 0: Populations are genetically identical
Fst = 1: Populations share no common alleles (complete differentiation)
In practice, human populations typically show Fst values between 0.01 and 0.25, reflecting our species' relatively recent common ancestry and ongoing gene flow throughout history.
How Fst is Calculated
The calculation of Fst involves comparing genetic variation within populations to the total genetic variation across all populations being studied. The formula is:
Fst = (HT - HS) / HT
Where:
HT = Total expected heterozygosity (genetic diversity across all populations)
HS = Average expected heterozygosity within subpopulations
This seemingly simple formula captures a profound biological concept: when populations are more genetically similar to each other, the within-population diversity (HS) approaches the total diversity (HT), making Fst approach zero. When populations are highly differentiated, within-population diversity becomes much smaller than total diversity, pushing Fst toward higher values.
Interpreting Fst Values
Geneticists typically interpret Fst values using these guidelines:
Fst Range Interpretation 0.00-0.05 Very little differentiation 0.05-0.15 Moderate differentiation 0.15-0.25 Great differentiation >0.25 Very great differentiation
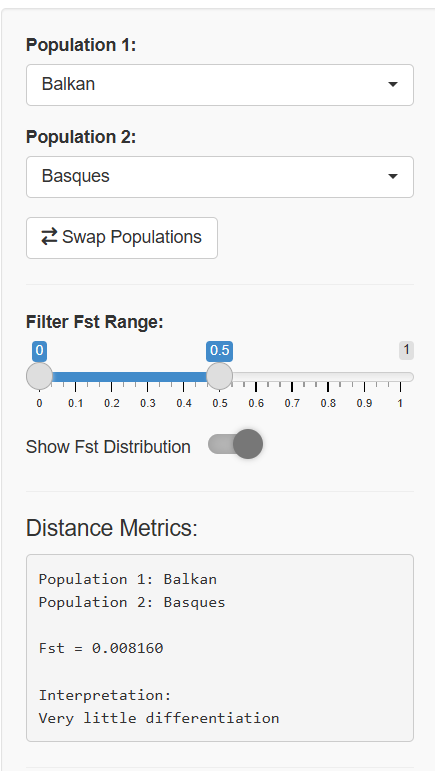
For context, most human populations fall within the "very little" to "moderate" differentiation range, reflecting our species' shared evolutionary history and the relatively short time since major population dispersals.
Building the Dataset: A Journey Through Human Genomics
Creating a comprehensive dataset of human genetic diversity required aggregating genomic data from multiple sources, each with its own sampling strategies and methodological approaches.
Data Sources
Academic Publications: Dozens of specialized studies contributed data from specific regions or populations, filling gaps in geographic coverage and providing insights into populations with unique evolutionary histories.
1000 Genomes Project: This landmark international collaboration provided high-quality genomic data from 26 populations across five continental regions. The project's strength lies in its systematic sampling approach and standardized sequencing protocols.
Human Genome Diversity Project (HGDP): Dating back to the 1990s, HGDP offers unique coverage of indigenous and isolated populations often underrepresented in other studies. This dataset was crucial for capturing the full spectrum of human genetic diversity.
The Integration Challenge
Combining these diverse datasets presented several technical challenges:
Standardization: Different studies used varying SNP panels, reference genomes, and quality control procedures. I implemented a rigorous harmonization pipeline to ensure comparable results across all data sources.
Population Definitions: Deciding how to define and label populations required careful consideration of both genetic clustering patterns and cultural/geographic boundaries. Some populations showed clear genetic distinctiveness despite geographic proximity, while others were genetically similar across vast distances.
Quality Control: Each dataset underwent extensive quality filtering to remove low-quality variants, individuals with high levels of missing data, and closely related individuals that could skew population-level statistics.
Computational Pipeline
The final analysis pipeline processed over 100 populations using Hudson's Fst estimator, chosen for its robustness with different sample sizes and its ability to handle missing data effectively. The calculations were performed on high-performance computing clusters, generating a comprehensive matrix of pairwise genetic distances.
The Interactive Tool: Making Genetics Accessible
The resulting dataset powers an interactive web application that transforms abstract genetic statistics into intuitive visualizations.
Key Features
Population Comparison: Select any two populations to see their exact genetic distance, complete with interpretation guidelines and contextual information about the populations' geographic origins and histories.
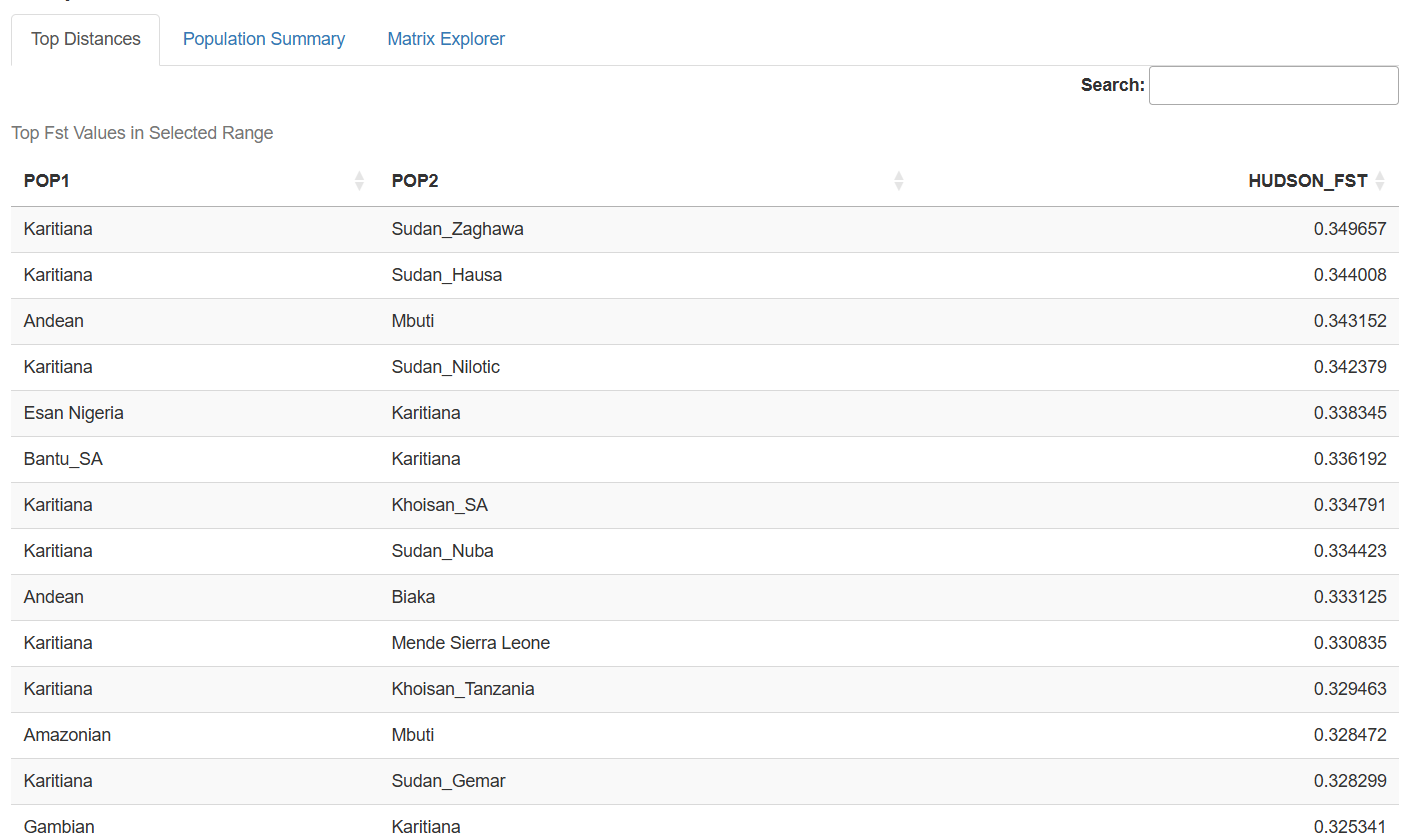
Top Distances Table: Dynamically filtered tables showing the most differentiated population pairs within user-specified Fst ranges, perfect for identifying the most genetically distinct groups in the dataset.
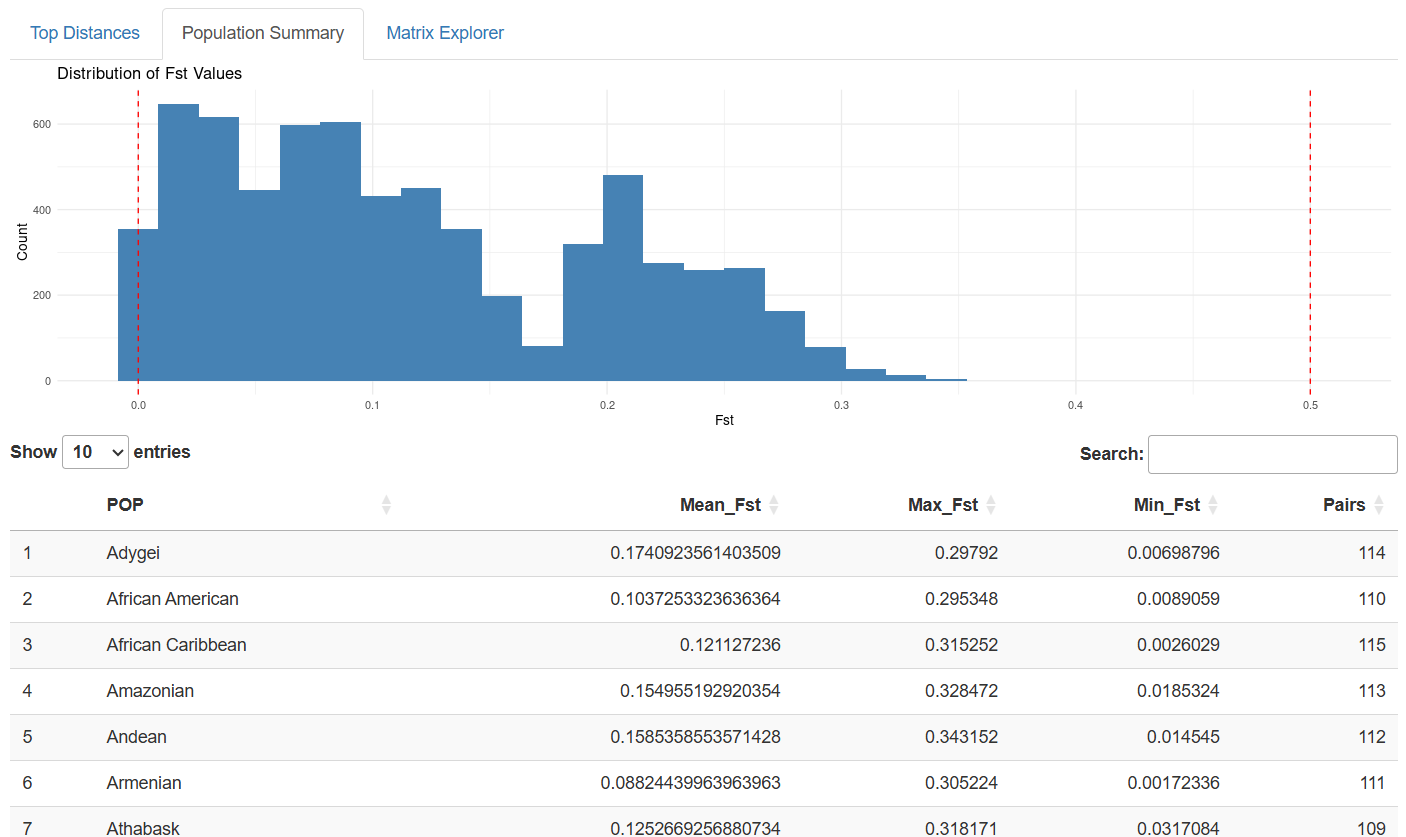
Distribution Analysis: Histogram visualizations reveal the overall distribution of genetic distances, helping users understand where their populations of interest fit within the broader landscape of human diversity.
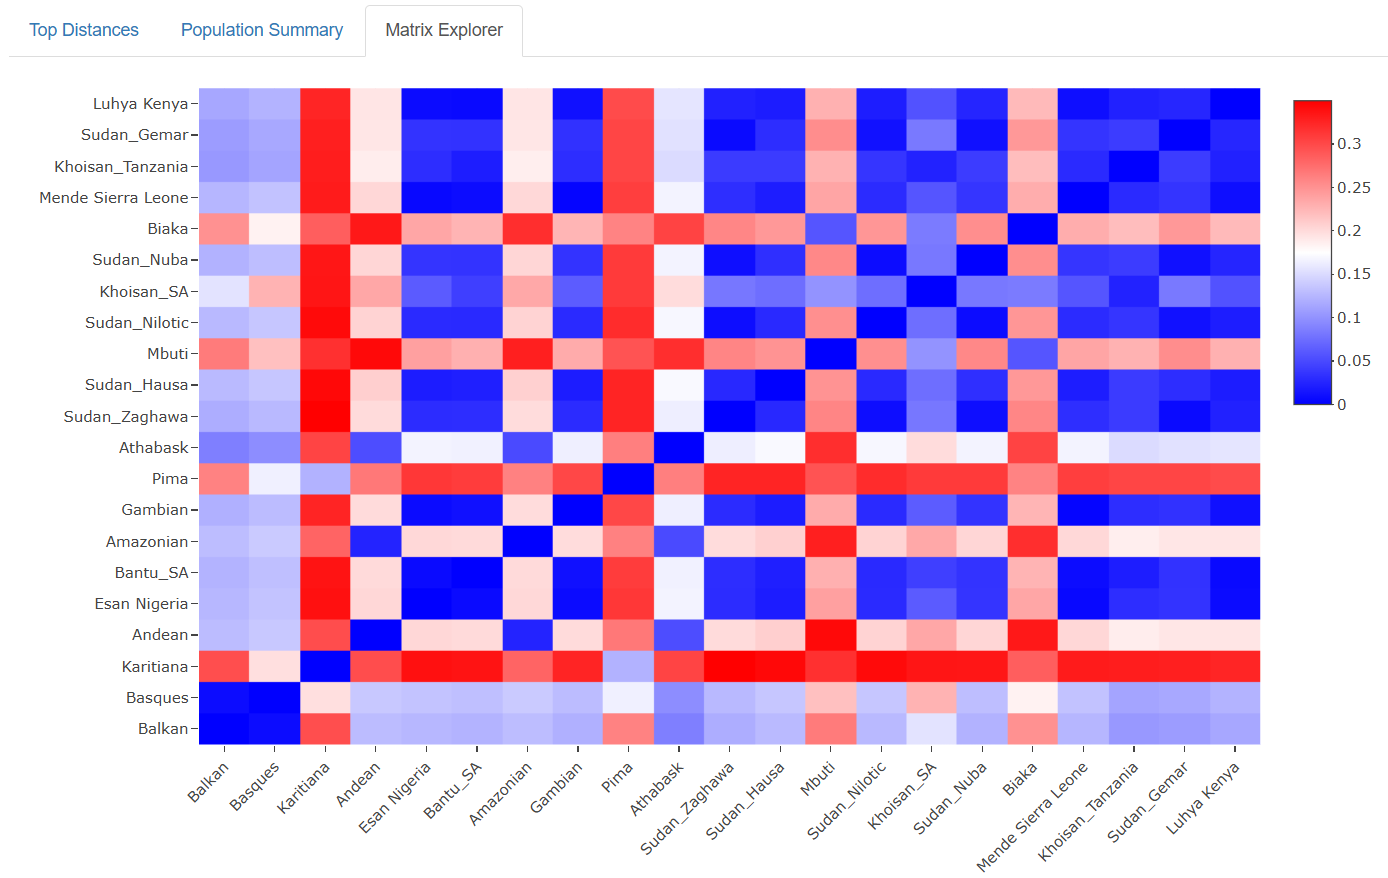
Interactive Heatmap: The visualization displays all pairwise Fst values as a color-coded matrix. Users can hover over any cell to see exact values and population names, making it easy to explore relationships between specific groups.
What the Data Reveals
The patterns emerging from this comprehensive dataset tell fascinating stories about human history:
Continental Clustering: Populations from the same continent generally show lower Fst values, reflecting shared evolutionary history and ongoing gene flow.
Isolation Effects: Island populations and those from remote geographic regions often show elevated Fst values, demonstrating the genetic impact of geographic isolation.
Migration Signatures: Some populations show genetic affinities that transcend simple geographic distance, revealing ancient migration routes and historical connections.
Recent Admixture: Several populations display genetic profiles reflecting recent mixing between distinct ancestral groups, particularly in regions with complex colonial histories.
Access and Availability
Understanding that comprehensive genetic resources should be accessible to the scientific community, I've structured access to this tool on multiple levels:
Free Version: Available to everyone, featuring 10 carefully selected populations that represent major patterns of human genetic diversity. This version includes all core functionality and serves as an excellent introduction to population genetics concepts.
Full Version: Available to subscribers, featuring the complete dataset of over 100 populations from around the world. This comprehensive version enables detailed exploration of regional genetic patterns and includes populations from underrepresented groups often missing from commercial genetic databases.
Future Directions
This tool represents just the beginning of making population genetic data more accessible. Future enhancements will include:
Temporal Analysis: Incorporating ancient DNA data to show how genetic distances have changed over time
Admixture Modeling: Tools for exploring population mixing and migration patterns
Polygenic scores: Map of polygenic scores for medical and psychological traits.
Below (paid subscribers only) you will find the link to the full version with 116 populations.
