
Please, Have a Seat: Sitting Height Ratio and Human Variation

Two populations can differ in height, but they can also differ in something more specific: how height is distributed between torso and legs. Two people can be the same height and still have very different bodies: one long-legged and short-torsoed, the other the opposite. That difference, how height is partitioned, is a separate trait.
Anthropologists have long been interested in differences in body proportions across human populations. One reason is that these differences often fit a broader zoological pattern known as Allen’s rule. In mammals and birds, populations and species from colder environments tend to have shorter extremities, while those from warmer environments tend to have longer ones. The usual explanation is thermoregulatory. Heat is lost through the body surface, whereas heat production depends more on body mass. Longer limbs increase surface area relative to volume and can facilitate heat dissipation; shorter limbs do the opposite and help conserve heat.

That makes Allen’s rule a plausible framework for thinking about human variation in limb proportions, but it is not a complete explanation. Body proportions are influenced by many factors, including nutrition, disease burden, developmental conditions, and the history of population mixture and drift. Even if climate mattered, it is not obvious whether the resulting differences are mainly genetic, mainly developmental, or some combination of the two. In animals more generally, both routes are possible: some differences reflect evolved genetic divergence, while others can arise through plastic responses during growth.
This was the unresolved issue in humans. The older anthropological literature documented recurrent population differences in relative limb length and trunk length, but it was much less able to say what produced them. Were these differences primarily developmental responses to local conditions, or did they also reflect genetic differences between populations?
Bartell et al. revisit this question with samples large enough to study body proportions at GWAS scale. Using very large samples from the UK Biobank and China Kadoorie Biobank, they study sitting height ratio and related traits at GWAS scale. The key measure is the sitting height ratio, or SHR, the fraction of total height accounted for by the torso. Higher SHR means relatively longer trunks and shorter legs; lower SHR means the reverse.
The resulting pattern is not limited to a single comparison. East Asian ancestry individuals show higher SHR than Europeans, and the broader multi-ancestry comparison places African, South Asian, European, and East Asian groups along the same general axis, with lower SHR corresponding to relatively longer limbs. In the main comparison reported in the paper, East Asian individuals have an average SHR of about 0.539, compared with 0.530 in Europeans. Taken together, the ordering is clear: African ancestry groups are lowest, followed by South Asians, then Europeans, with East Asians highest.
Figure 1. Sitting height ratio differs systematically across ancestry groups in the UK Biobank.
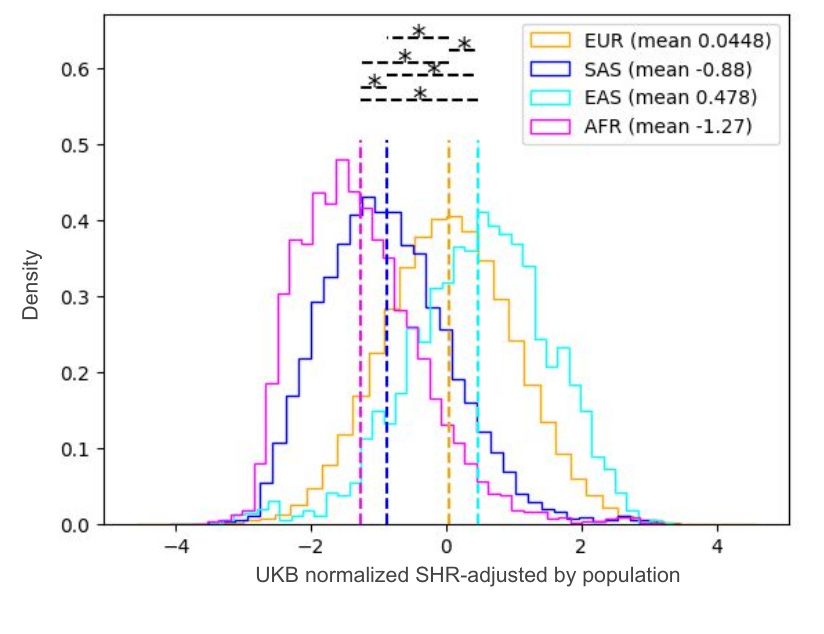
The ordering is consistent with the older climatic interpretation, but the main point is simpler. This is not an isolated contrast between two groups. The same broad gradient appears across multiple ancestry groups.
Earlier anthropometric work pointed in this direction, but the evidence was sparse. Here the pattern emerges clearly in very large samples. Populations differ not just in stature, but in body proportions.
Height, however, collapses multiple biological processes into a single measure. Sitting height ratio, once adjusted for height, is almost genetically independent from height itself. Two individuals can have the same genetic propensity for height and still differ in how that height is distributed between trunk and legs. The variants that make you taller are often not the same variants that determine your proportions.
The study identifies roughly five hundred loci associated with SHR. Many lie in regions already associated with height, but often involve different variants within those regions. The same locus can contain one variant that affects overall height and another that shifts proportions. In some cases, variants decrease sitting height while increasing leg length by a larger amount, showing that these are not just general growth effects but region-specific effects on the skeleton.
There are clear phenotypic differences across populations, but that does not imply different genetic systems. At the genome-wide level, the opposite is true. Genetic correlations across ancestries are close to one, and effect sizes at associated loci are very similar.
Figure 2. The genetic architecture of body proportions is largely shared across European and East Asian populations
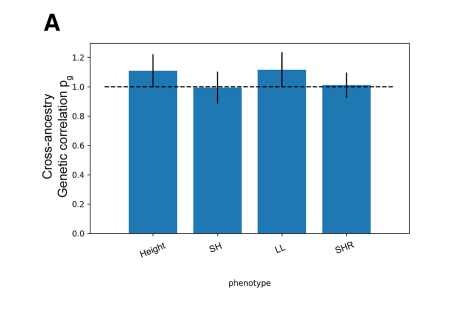
This does not mean every locus is identical across populations. A small number of fine-mapped signals do show heterogeneity. But they are a minority. The overall architecture is overwhelmingly shared. Population differences in body proportions are therefore not explained by different sets of genes, but by differences in allele frequencies across many of the same loci.
What the paper does not show, however, is the most direct test of that interpretation. If the population differences are really genetic, then populations should differ not just in phenotype, but in their average polygenic propensity for higher sitting height ratio. I computed those scores by population using the GWAS summary statistics, and the pattern is exactly what you would expect.
