
The Farmer Signal in Intelligence Appears in East Asia Too: The Rise of the Han

There is a pattern in ancient DNA that keeps reappearing: the first large farming populations did not just change how people ate. They changed the biological and social trajectory of entire continents.
In Europe, I previously found a positive association between Early European Farmer / Anatolian farmer ancestry and educational-attainment PGS. That was not just an isolated observation: Akbari et al. later reported a similar farmer-related signal in their ancient-DNA analysis. So the European comparison is not merely that farmers expanded. It is that farmer ancestry appears to carry a detectable positive EA signal.
But Europe is not the only test case. China had its own great Neolithic agricultural cores, especially around the Yellow River and the eastern farming societies of Shandong. If farming populations really carried a distinctive trait profile, we should not expect the signal to stop at the Bosporus. We should see something similar in East Asia.
That is what I find here.
Using an imputed ancient East Asian dataset, imputed with GLIMPSE and then scored for several polygenic traits, I find that educational-attainment PGS rises through time in East Asia. The trend remains after controlling for ancestry, latitude, and sequencing coverage. Skin-colour scores also move in the expected direction: light-skin PGS rises and dark-skin PGS falls. Height, however, does not show the same robust increase.
The most interesting part is where the EA signal sits. The strongest positive independent ancestry effect is Yellow River / northern farmer ancestry. And the highest descriptive EA means appear in Shandong Neolithic farmer-related ancestry. In other words: the high-scoring signal is not random. It clusters around the old farming heartlands.
This suggest that the same broad pattern seen in Europe may also appear in East Asia: farming expansions may have carried more than crops.
What Was Scored
I scored four traits:
educational attainment, averaging standardized EA3 and EA4 scores
height
light skin colour, using the Kim et al. skin-colour GWAS
dark skin colour, using the Pan-UKBB meta-analysis skin-colour GWAS
The genomes are ancient, imputed with GLIMPSE, and then scored using modern GWAS summary statistics. That immediately requires caution. Ancient PGS are noisy. GWAS portability is imperfect. Coverage, imputation quality, and ancestry structure can all matter.
So the key question is not whether a raw score rises or falls. The key question is whether the trend survives ancestry and technical controls.
The main model is:
Z_PGS ~ Date + ADMIXTURE + Latitude + Coverage
Date is in years before present. I report time effects as change per century forward in time.
I also fit interaction models:
Z_PGS ~ Date + ADMIXTURE + Date:ADMIXTURE + Latitude + Coverage
These ask whether the time trend differs by ancestry.
Main Regression Effects
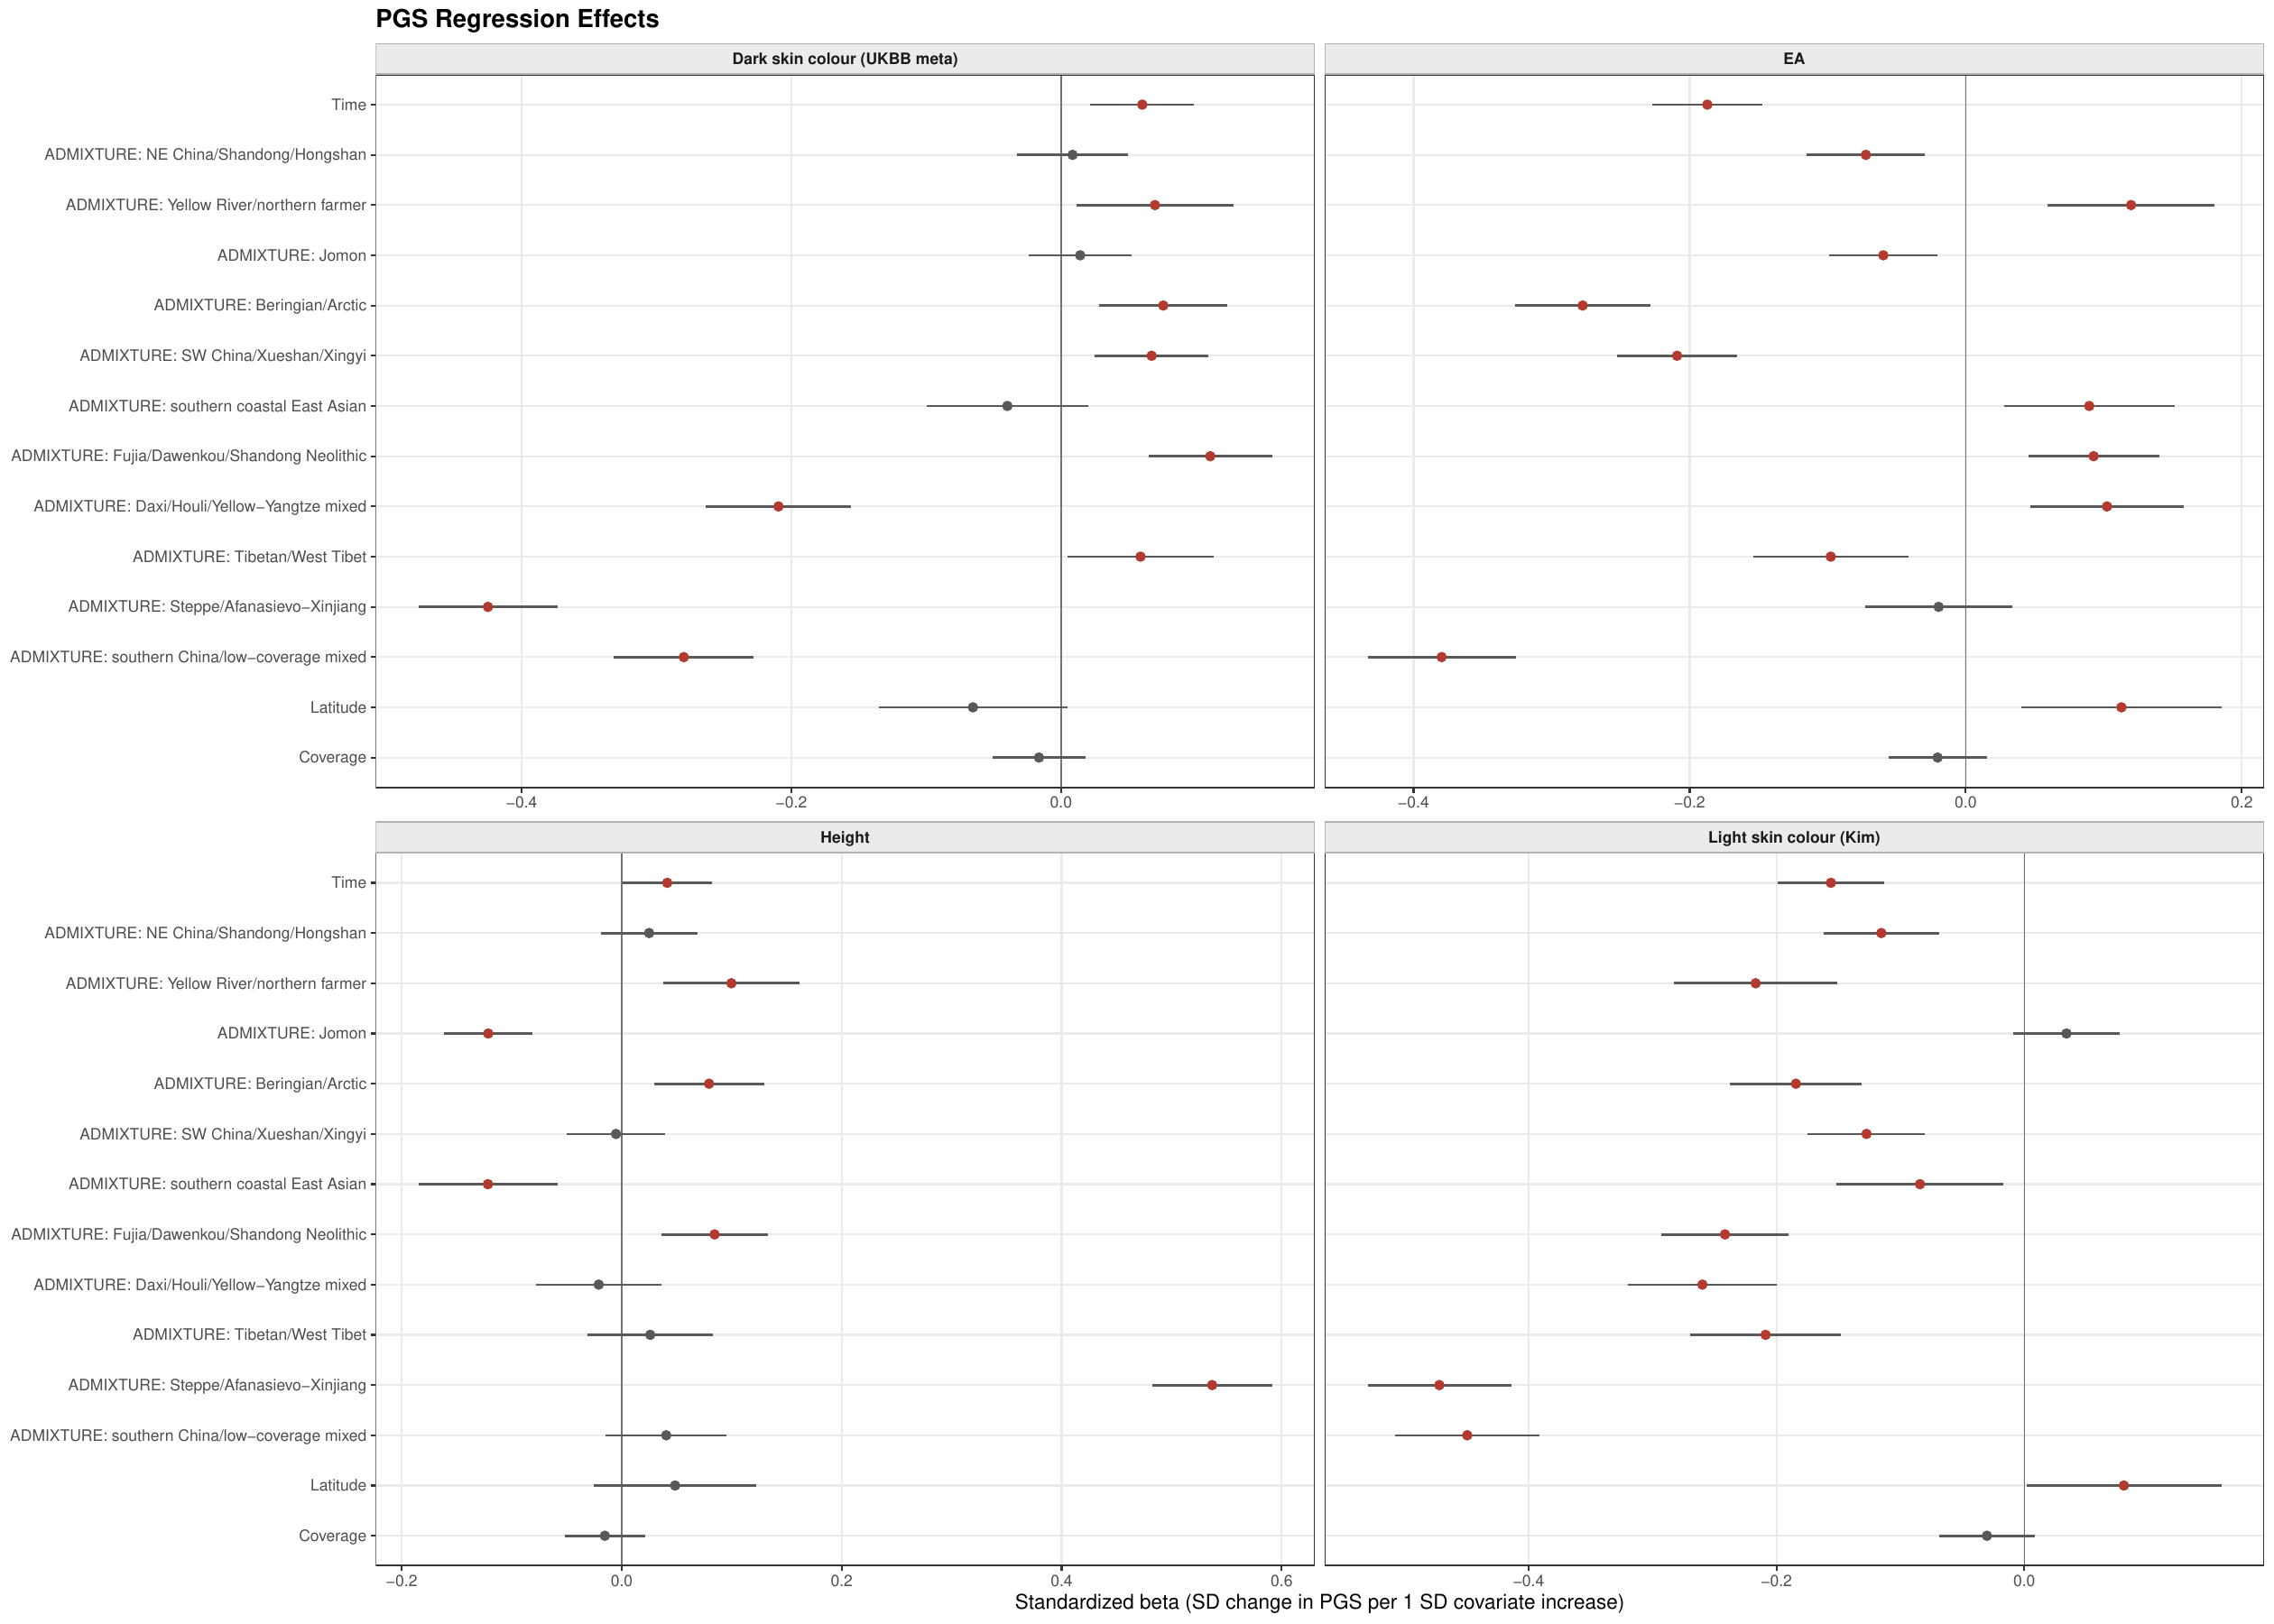
The first figure shows the standardized regression coefficients for EA, height, light skin colour, and dark skin colour after controlling for time, ancestry, latitude, and coverage.
Figure 1. Standardized regression effects for EA, height, light skin colour, and dark skin colour. Each point is a standardized coefficient from the ancestry-controlled regression. Error bars show approximate 95% confidence intervals.
The East Asian EA Trend Looks Like the European One
The table below compares the time trend before and after controlling for ancestry. If the signal were just ancestry turnover, the EA trend should collapse after ADMIXTURE is added. It does not.
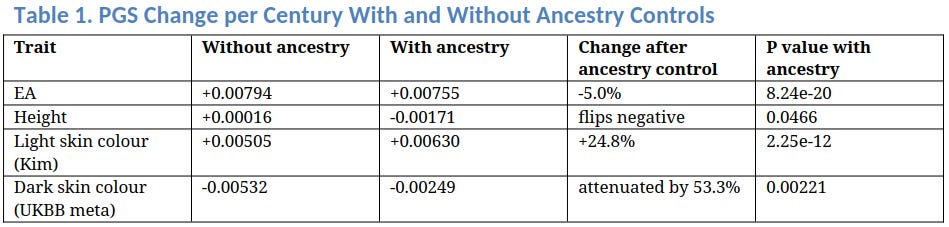
EA increases through time whether or not ancestry is controlled. Light-skin PGS also increases, while dark-skin PGS decreases. Height does not replicate the same pattern.
The EA increase is not large per century, but it is consistent and highly significant. It also remains almost unchanged after ancestry control: the ancestry-adjusted slope is only about 5% smaller than the unadjusted slope.
That looks like the European pattern. EA-associated alleles increase through time, and the trend is not simply erased by adding ancestry.
Skin colour also behaves as expected. Light-skin PGS rises. Dark-skin PGS falls. Height does not join the party: it is basically null without ancestry control and weakly negative after ancestry control. This is different from what I found in Europe, and likely explains the fact that East Asians are shorter than Europeans.
The EA Trend Is Not the Same in Every Ancestry
If a single homogeneous process were operating across all East Asian groups, the time trend would look similar in every ancestry component. It does not.
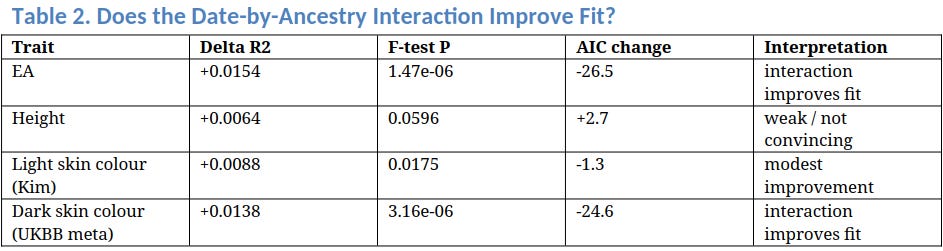
Adding Date × ancestry terms improves model fit for EA and dark skin colour, modestly for Kim light skin, and not convincingly for height. BIC penalizes the extra terms heavily, so I treat this as evidence of heterogeneity rather than final model selection.
The EA trend differs by ancestry. That matters because it tells us the signal is not just a single line through all ancient East Asians. Some ancestry backgrounds show stronger increases than others.
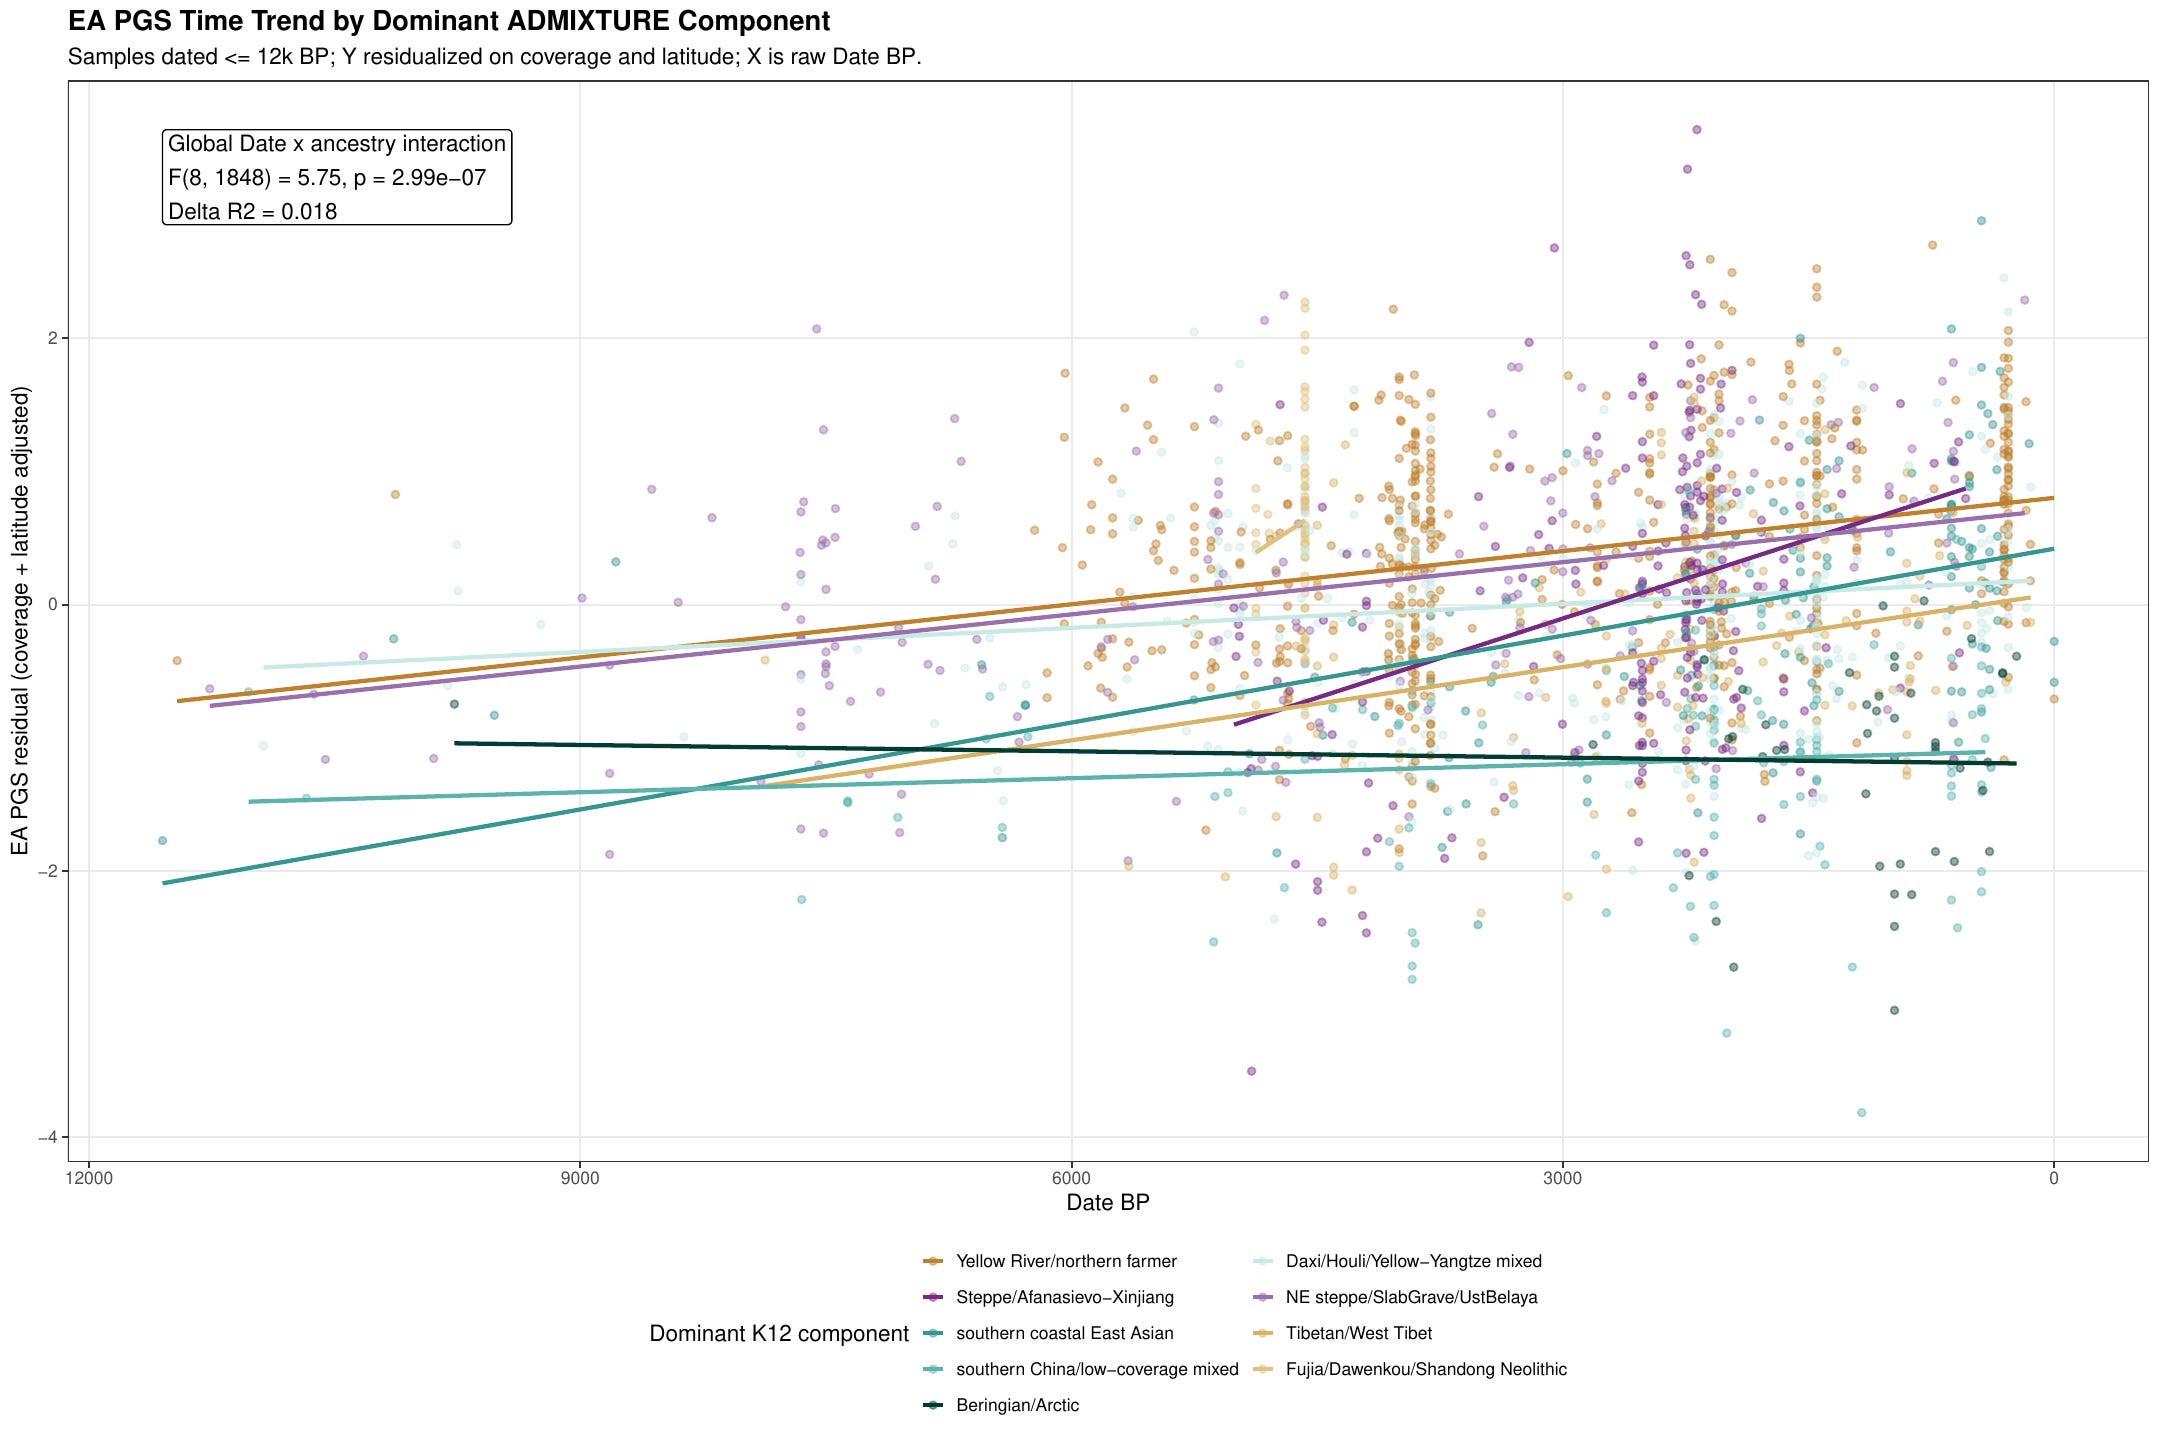
The next plot uses samples dated to the last 12,000 years to avoid a few very old samples stretching the x-axis. The Y variable is EA residualized on coverage and latitude. The X variable is raw date in years before present.
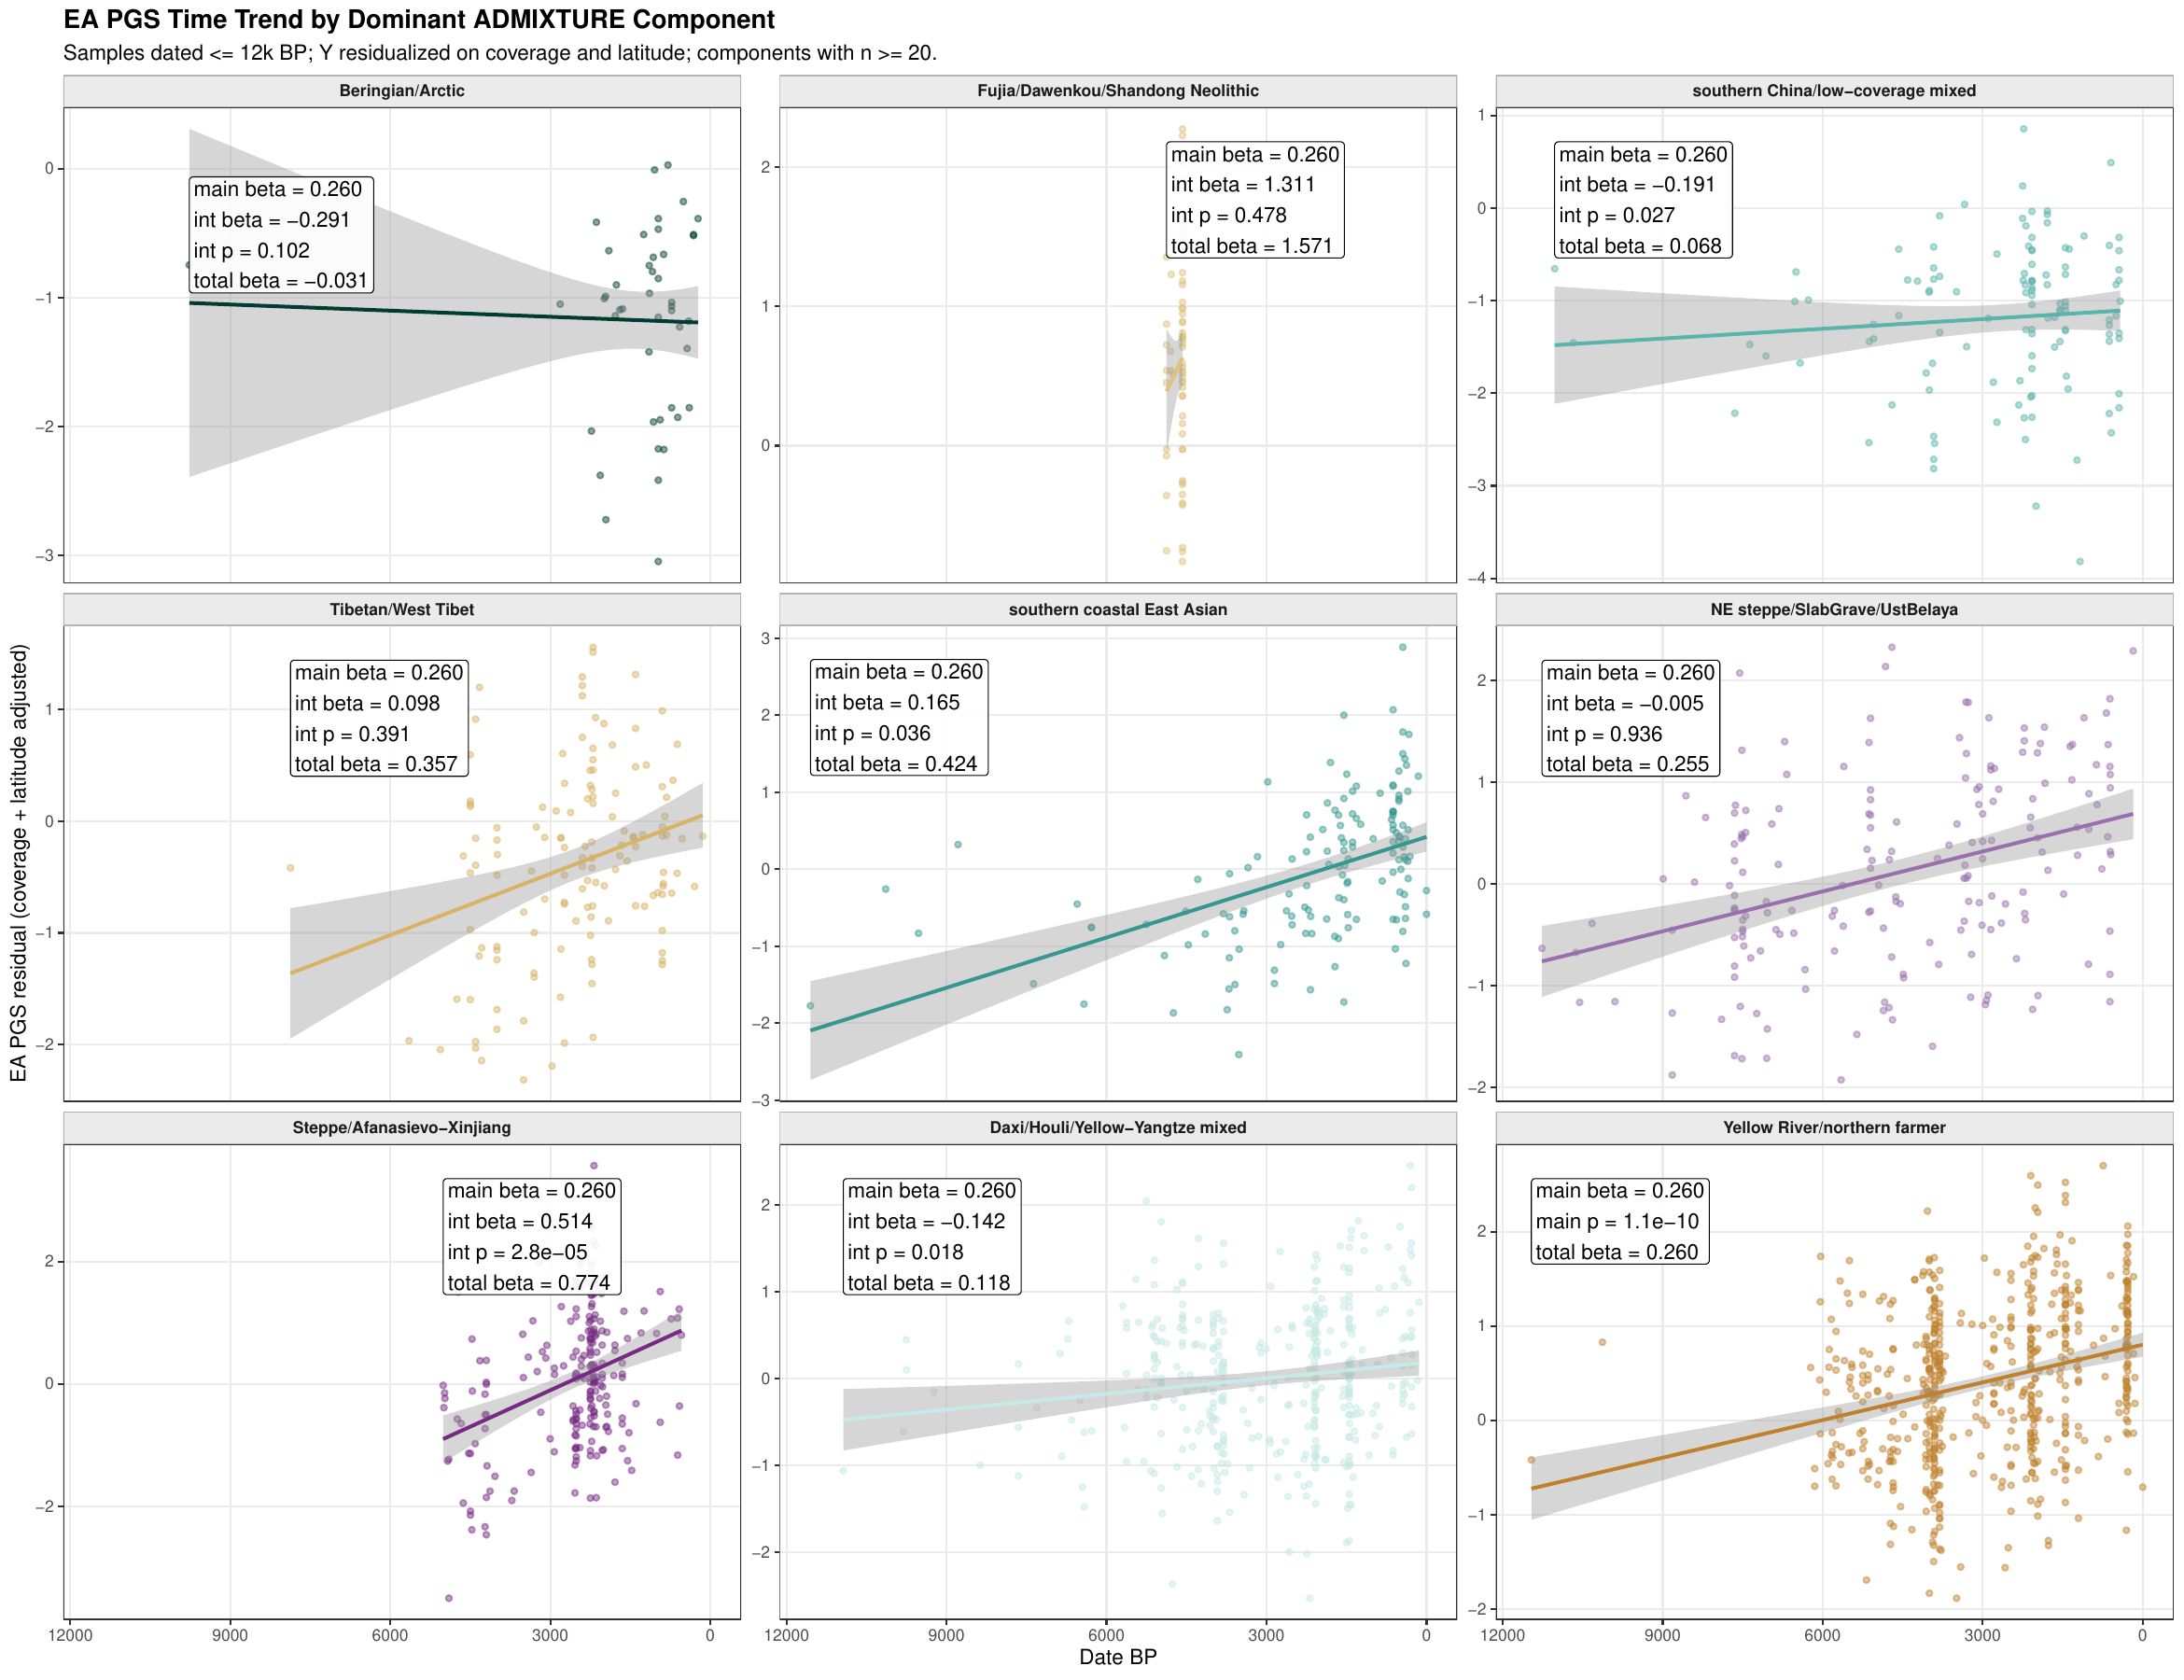
Figure 2. EA PGS time trend by dominant ADMIXTURE component, limited to samples dated ≤12k BP. The Y axis is EA residualized on coverage and latitude. The X axis is raw Date BP.
The faceted version makes the differences easier to see.
Each panel shows one dominant ancestry component. The labels report the main Date beta, the Date × component interaction beta, and the total beta. Positive values mean EA increases forward in time. Each panel shows one dominant ancestry component. The labels report the main Date beta, the Date × component interaction beta, and the total beta. Positive values mean EA increases forward in time.
Figure 3. Faceted EA PGS time trend by dominant ADMIXTURE component, ≤12k BP. Labels report standardized main, interaction, and total betas.
Which Ancestry Predicts Higher EA?
There are two ways to answer this, and they should not be confused.
The first is the better causal-style question: holding time, latitude, coverage, and the other ancestry components constant, which ancestry component independently predicts higher EA?
The four positive ancestry effects are all East Asian farmer-related, but they are not identical. Yellow River / northern farmer captures the Central Plain / Yellow River Neolithic axis, including Yangshao-Longshan-related ancestry. Central-East China farmer captures a central-eastern China axis with both Yangtze and lower Yellow River affinity. Fujia/Dawenkou/Shandong Neolithic is the local Shandong Neolithic farmer component, associated with Dawenkou/Fujia-related eastern coastal farming populations. Southern coastal East Asian captures a more southern/coastal ancestry profile, visible in coastal and later historical southern East Asian samples.
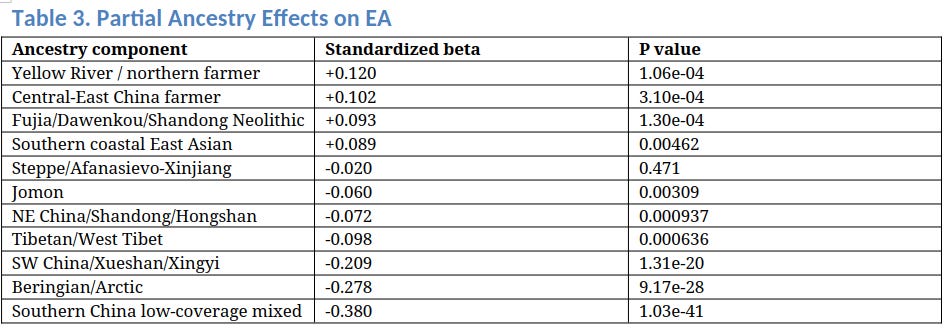
The strongest positive independent EA-associated ancestry effect is Yellow River / northern farmer ancestry. This is the component most closely aligned with the Central Plain / Yellow River agricultural substrate relevant to later northern Han formation.
The second question is descriptive: among individuals whose largest component is X, what is their average EA score? This is less clean because dominant groups differ in time, place, and mixture. But it is still useful.
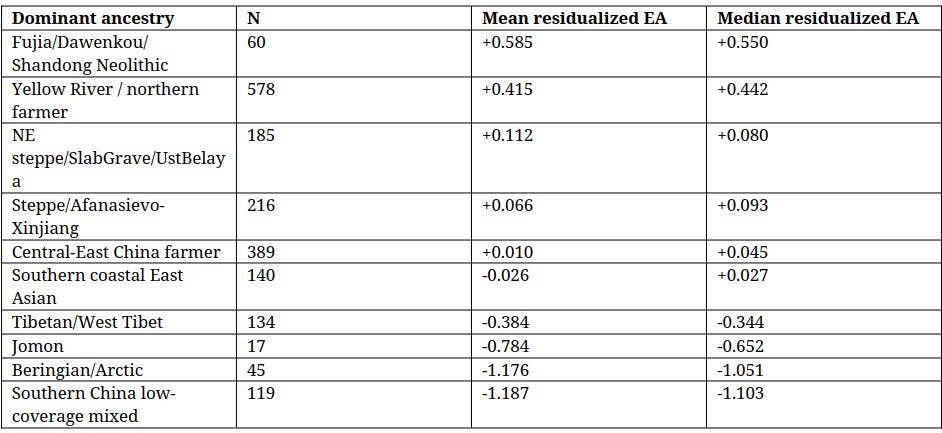
Dominant-component means are descriptive. Shandong Neolithic farmer-related ancestry has the highest mean EA, while Yellow River / northern farmer ancestry has the strongest positive partial effect in the multivariable model.
So the two results are complementary. Yellow River / northern farmer ancestry is the most robust independent predictor. Shandong Neolithic farmer ancestry has the highest descriptive mean.
Both point back to farmers.
Longshan, Shandong, and the Farming Signal
This is the finding I find most interesting.
The high-EA signal is not attached to random ancestry. It appears in two farmer-related components:
Yellow River / northern farmer ancestry, which peaks in Yangshao, Longshan, and related Yellow River Neolithic/Bronze Age groups
Fujia/Dawenkou/Shandong Neolithic ancestry, which represents eastern Neolithic farmer ancestry in Shandong
Dawenkou and Fujia-related groups are generally earlier than Longshan. Dawenkou is often dated roughly 4100-2600 BCE, while Longshan is roughly 3000/2600-1900 BCE. There is overlap at the transition, but the broad sequence is clear: eastern Neolithic farming groups precede and feed into later Longshan-era complexity.
This is where the comparison with Europe becomes hard to ignore. In Europe, Anatolian farmers were not just a demographic wave. They were the population layer that made Neolithic Europe possible. In East Asia, Yellow River and Shandong Neolithic farmers may have played a similar role.
Farming societies created a very different selection environment: sedentism, storage, hierarchy, craft specialization, property, accounting, coordination, and eventually states. Over many generations, these environments could sort or select for cognitive and personality traits useful in dense agrarian societies.
That is the farming-effect hypothesis.
Agriculture creates the niche. The niche changes the people.
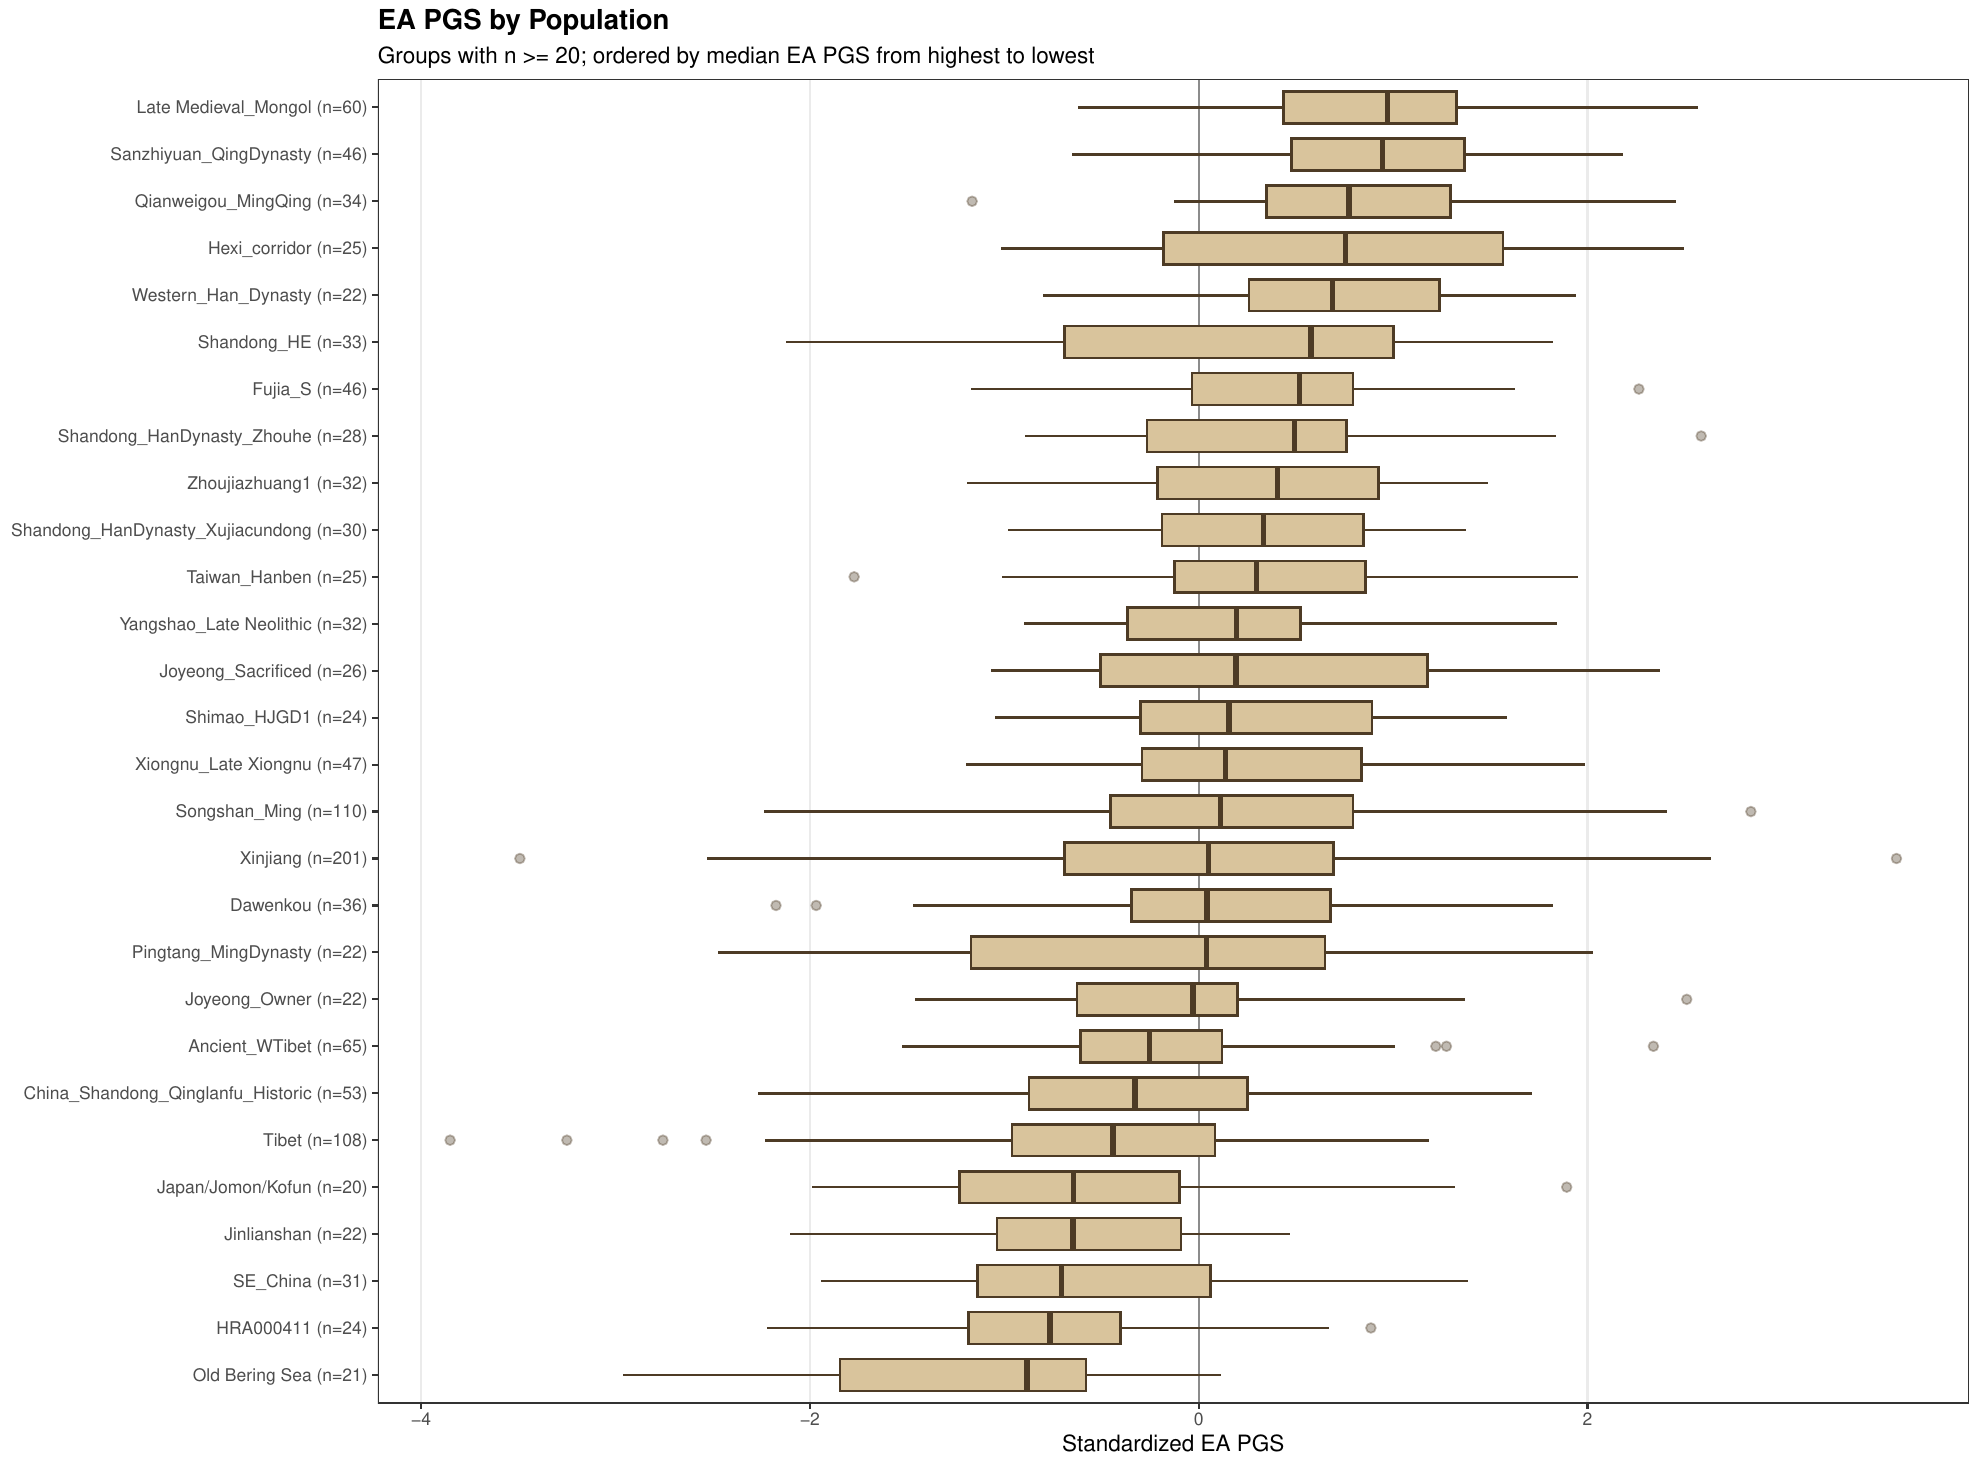
The next figure shows standardized EA PGS by metadata population, using groups with at least 20 individuals.
Figure 4. EA PGS boxplot by population, n ≥ 20. Groups are ordered by median EA PGS from highest to lowest.
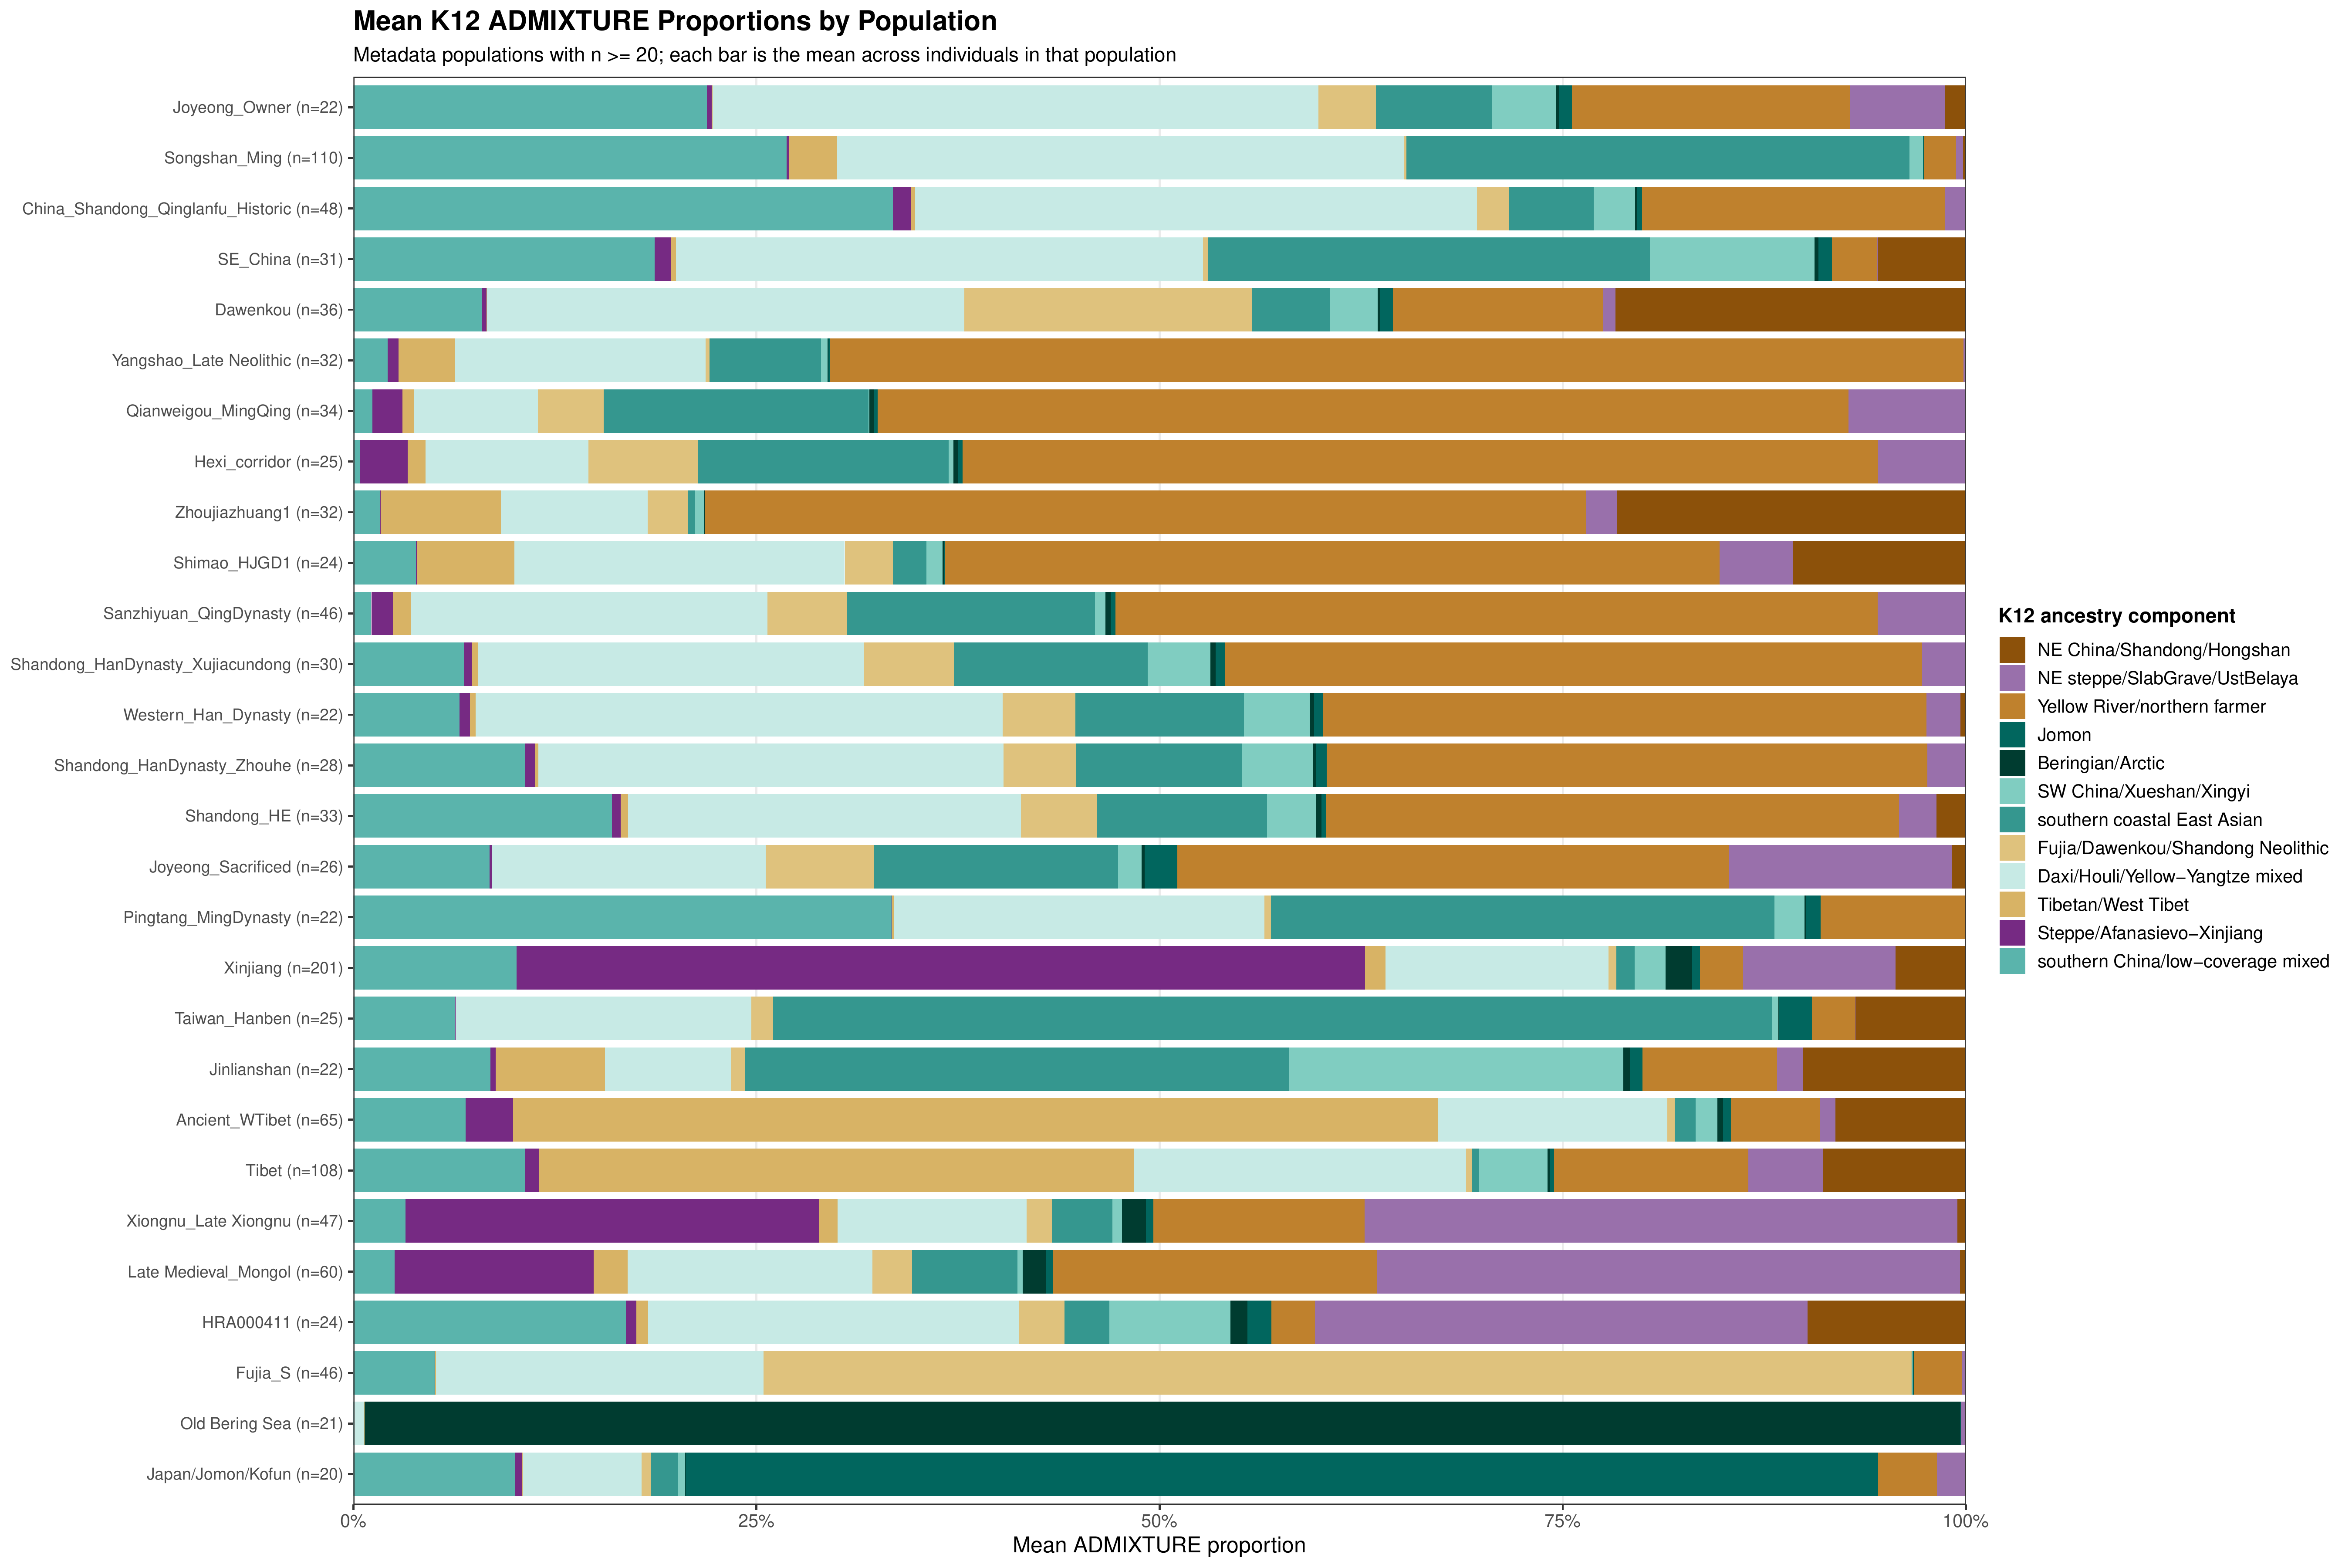
The ancestry profiles show why raw group means can be misleading. Many archaeological or historical labels are not pure ancestry blocks.
Figure 5. Mean K12 ADMIXTURE profile by population, n ≥ 20.
Did This Help Make the Han?
The genetic formation of the Han is usually told as a story of demography, agriculture, and state formation. Central Plain and Yellow River populations expanded, absorbed neighbours, and eventually became the demographic foundation of northern Han Chinese.
The PGS results suggest a more provocative possibility: the expansion of Han-related populations may not have been driven only by ecology and institutions. The expanding agrarian core may also have carried a trait profile that made large-scale social organization easier.
That would help explain why the Central Plain mattered so much. Millet agriculture gave it density. Geography gave it centrality. Longshan and later Bronze Age societies gave it hierarchy. The state gave it reach. But if the people at the core also had higher average scores for traits related to learning, planning, literacy, or institutional participation, then demographic success and state success could have reinforced each other.
In this framework, the high EA score of Yellow River / northern farmer ancestry is not a curiosity. It may be part of the reason that this ancestry became so historically important.
References
Akbari, A., Perry, A., Barton, A.R. et al. Ancient DNA reveals pervasive directional selection across West Eurasia. Nature (2026). https://doi.org/10.1038/s41586-026-10358-1
Kim, B., Kim, D.S., Shin, J.G. et al. Mapping and annotating genomic loci to prioritize genes and implicate distinct polygenic adaptations for skin color. Nature Communications 15, 4874 (2024). https://doi.org/10.1038/s41467-024-49031-4
Rubinacci, S., Ribeiro, D.M., Hofmeister, R.J. et al. Efficient phasing and imputation of low-coverage sequencing data using large reference panels. Nature Genetics 53, 120-126 (2021). https://doi.org/10.1038/s41588-020-00756-0
Lee, J.J., Wedow, R., Okbay, A. et al. Gene discovery and polygenic prediction from a genome-wide association study of educational attainment in 1.1 million individuals. Nature Genetics 50, 1112-1121 (2018). https://doi.org/10.1038/s41588-018-0147-3
Yengo, L., Vedantam, S., Marouli, E. et al. A saturated map of common genetic variants associated with human height. Nature 610, 704-712 (2022). https://doi.org/10.1038/s41586-022-05275-y
Davide, Thanks for the continuing analysis of the farming/intelligence connection.
What interests me is the cause/effect or chicken/egg question. What are your thoughts?