
The Genetic Geography of Patience
Across 49 countries, nine measures point the same way—but the signal weakens after accounting for population history

Would you rather receive a smaller reward today or a larger reward later? The rate at which people devalue delayed rewards is called delay discounting. Steeper discounting means a stronger preference for the immediate option; shallower discounting is one behavioral expression of patience.
A new genome-wide association study by Thorpe and colleagues identified 11 loci associated with delay discounting in 134,935 US participants who clustered with European genetic reference panels. Of nine genome-wide-significant signals supplied with the GWAS materials, six could be aligned and scored in the international genetic datasets used here. I asked a deliberately simple question: do countries with a higher delay-discounting polygenic score also tend to look less patient on independent behavioral, survey, and cultural measures?
At the descriptive level, every patience measure with enough country matches correlates with the genetic score in the predicted negative direction.
What the score means
A higher score means more weight on the six genetic variants associated with steeper delay discounting—the tendency to choose a sooner reward over a later one. I will call this the impatience direction for shorthand.
The score is deliberately small and transparent: it is a weighted sum of six genome-wide-significant variants from the discovery GWAS, rather than a large predictor tuned to maximize accuracy in a new sample. The discovery study was conducted in a European-ancestry sample, so the same score may not transport equally well to every population.
I estimated the score in pooled genotypes and in a 51-panel frequency resource. Where several represented populations contributed to one country, I used documented population shares where available rather than treating every panel as equally large. The result is 49 country-level estimates.
A few countries required special population-share reconstructions, including Israel and Russia.
Read the score, then, as a transparent geographic signal with substantial uncertainty.
The geography of the score
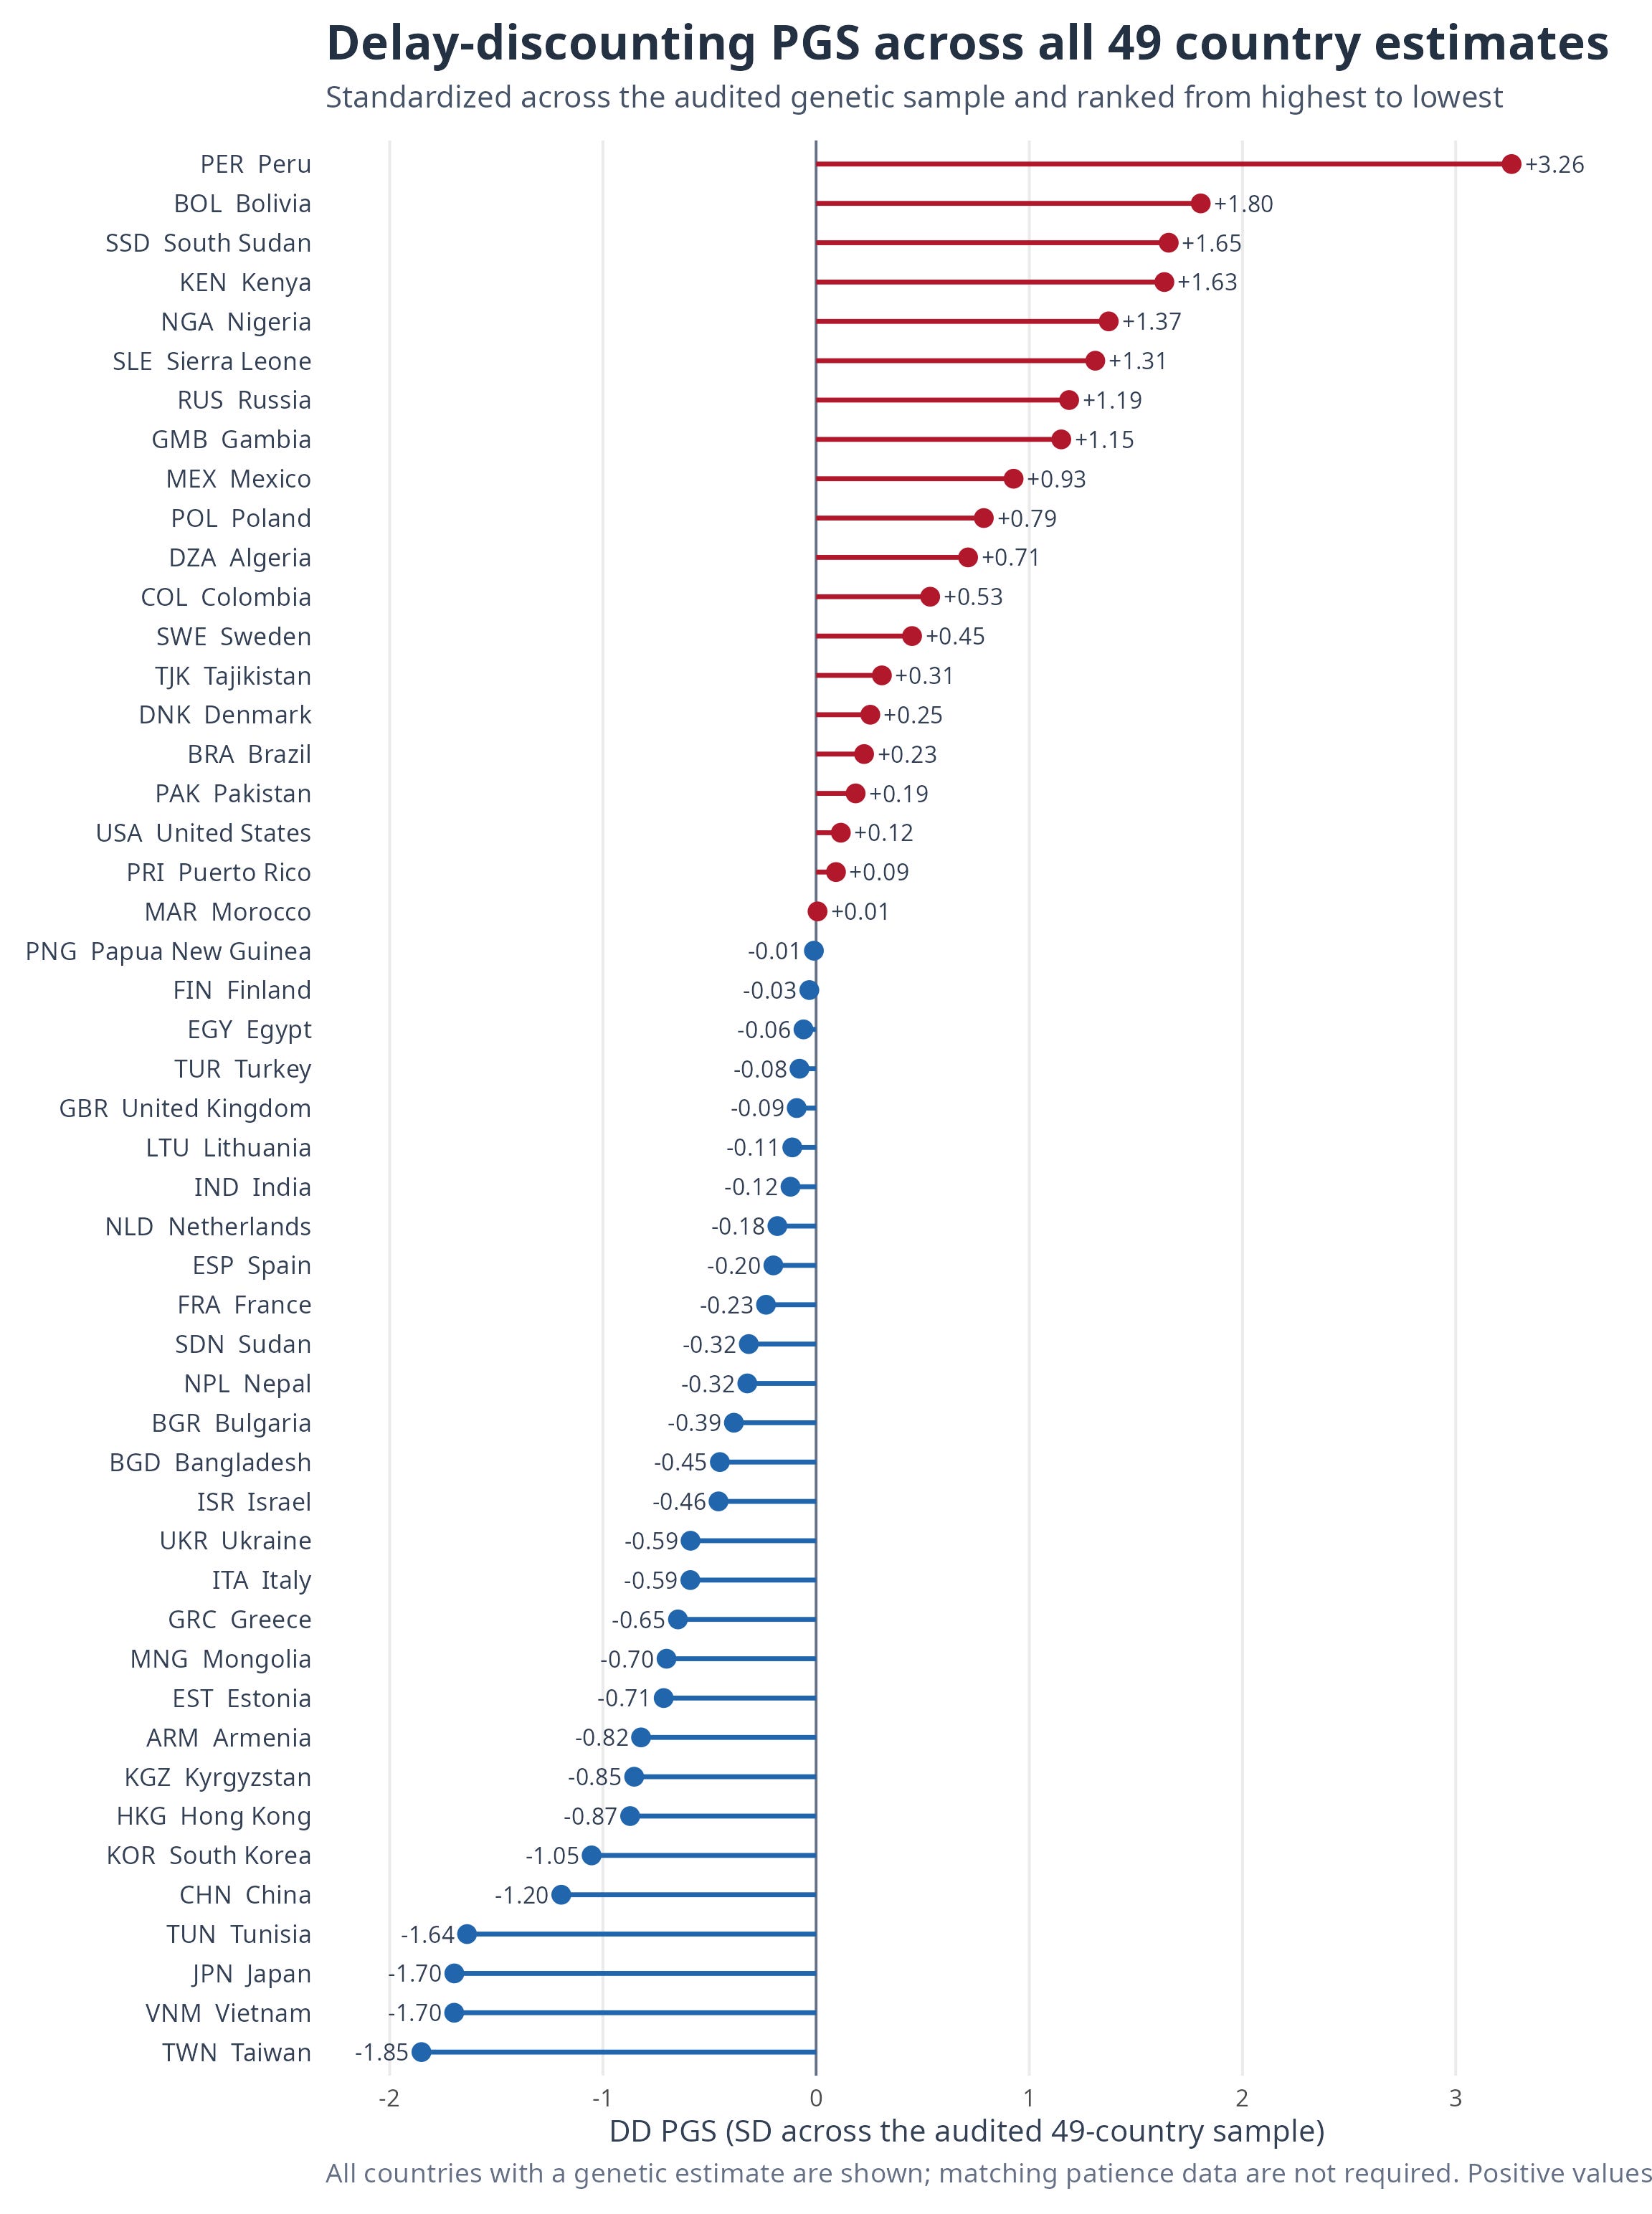
Figure 1 maps the standardized DD PGS across all 49 country-level estimates, and Figure 2 ranks them. In the steeper-discounting direction, Peru is the clear outlier (3.26 SD above the 49-country mean), followed by Bolivia, South Sudan, Kenya and Nigeria. At the other end are Taiwan, Vietnam, Japan, Tunisia and China. In the score’s own direction, the first group is genetically more immediate-reward oriented and the second group less so.
There is a broad continental pattern, but not a tidy continental league table. The highest values cluster in the Andean and sub-Saharan estimates; the lowest cluster in East Asia. Europe mostly sits nearer the middle, while the Americas are highly heterogeneous: Peru and Bolivia are at the high end, whereas the United States is close to the sample mean. North Africa and West Asia also span both sides of the distribution. The map is therefore more informative than a single continental average.
Figure 1. Delay-discounting PGS in the audited 49-country score sample
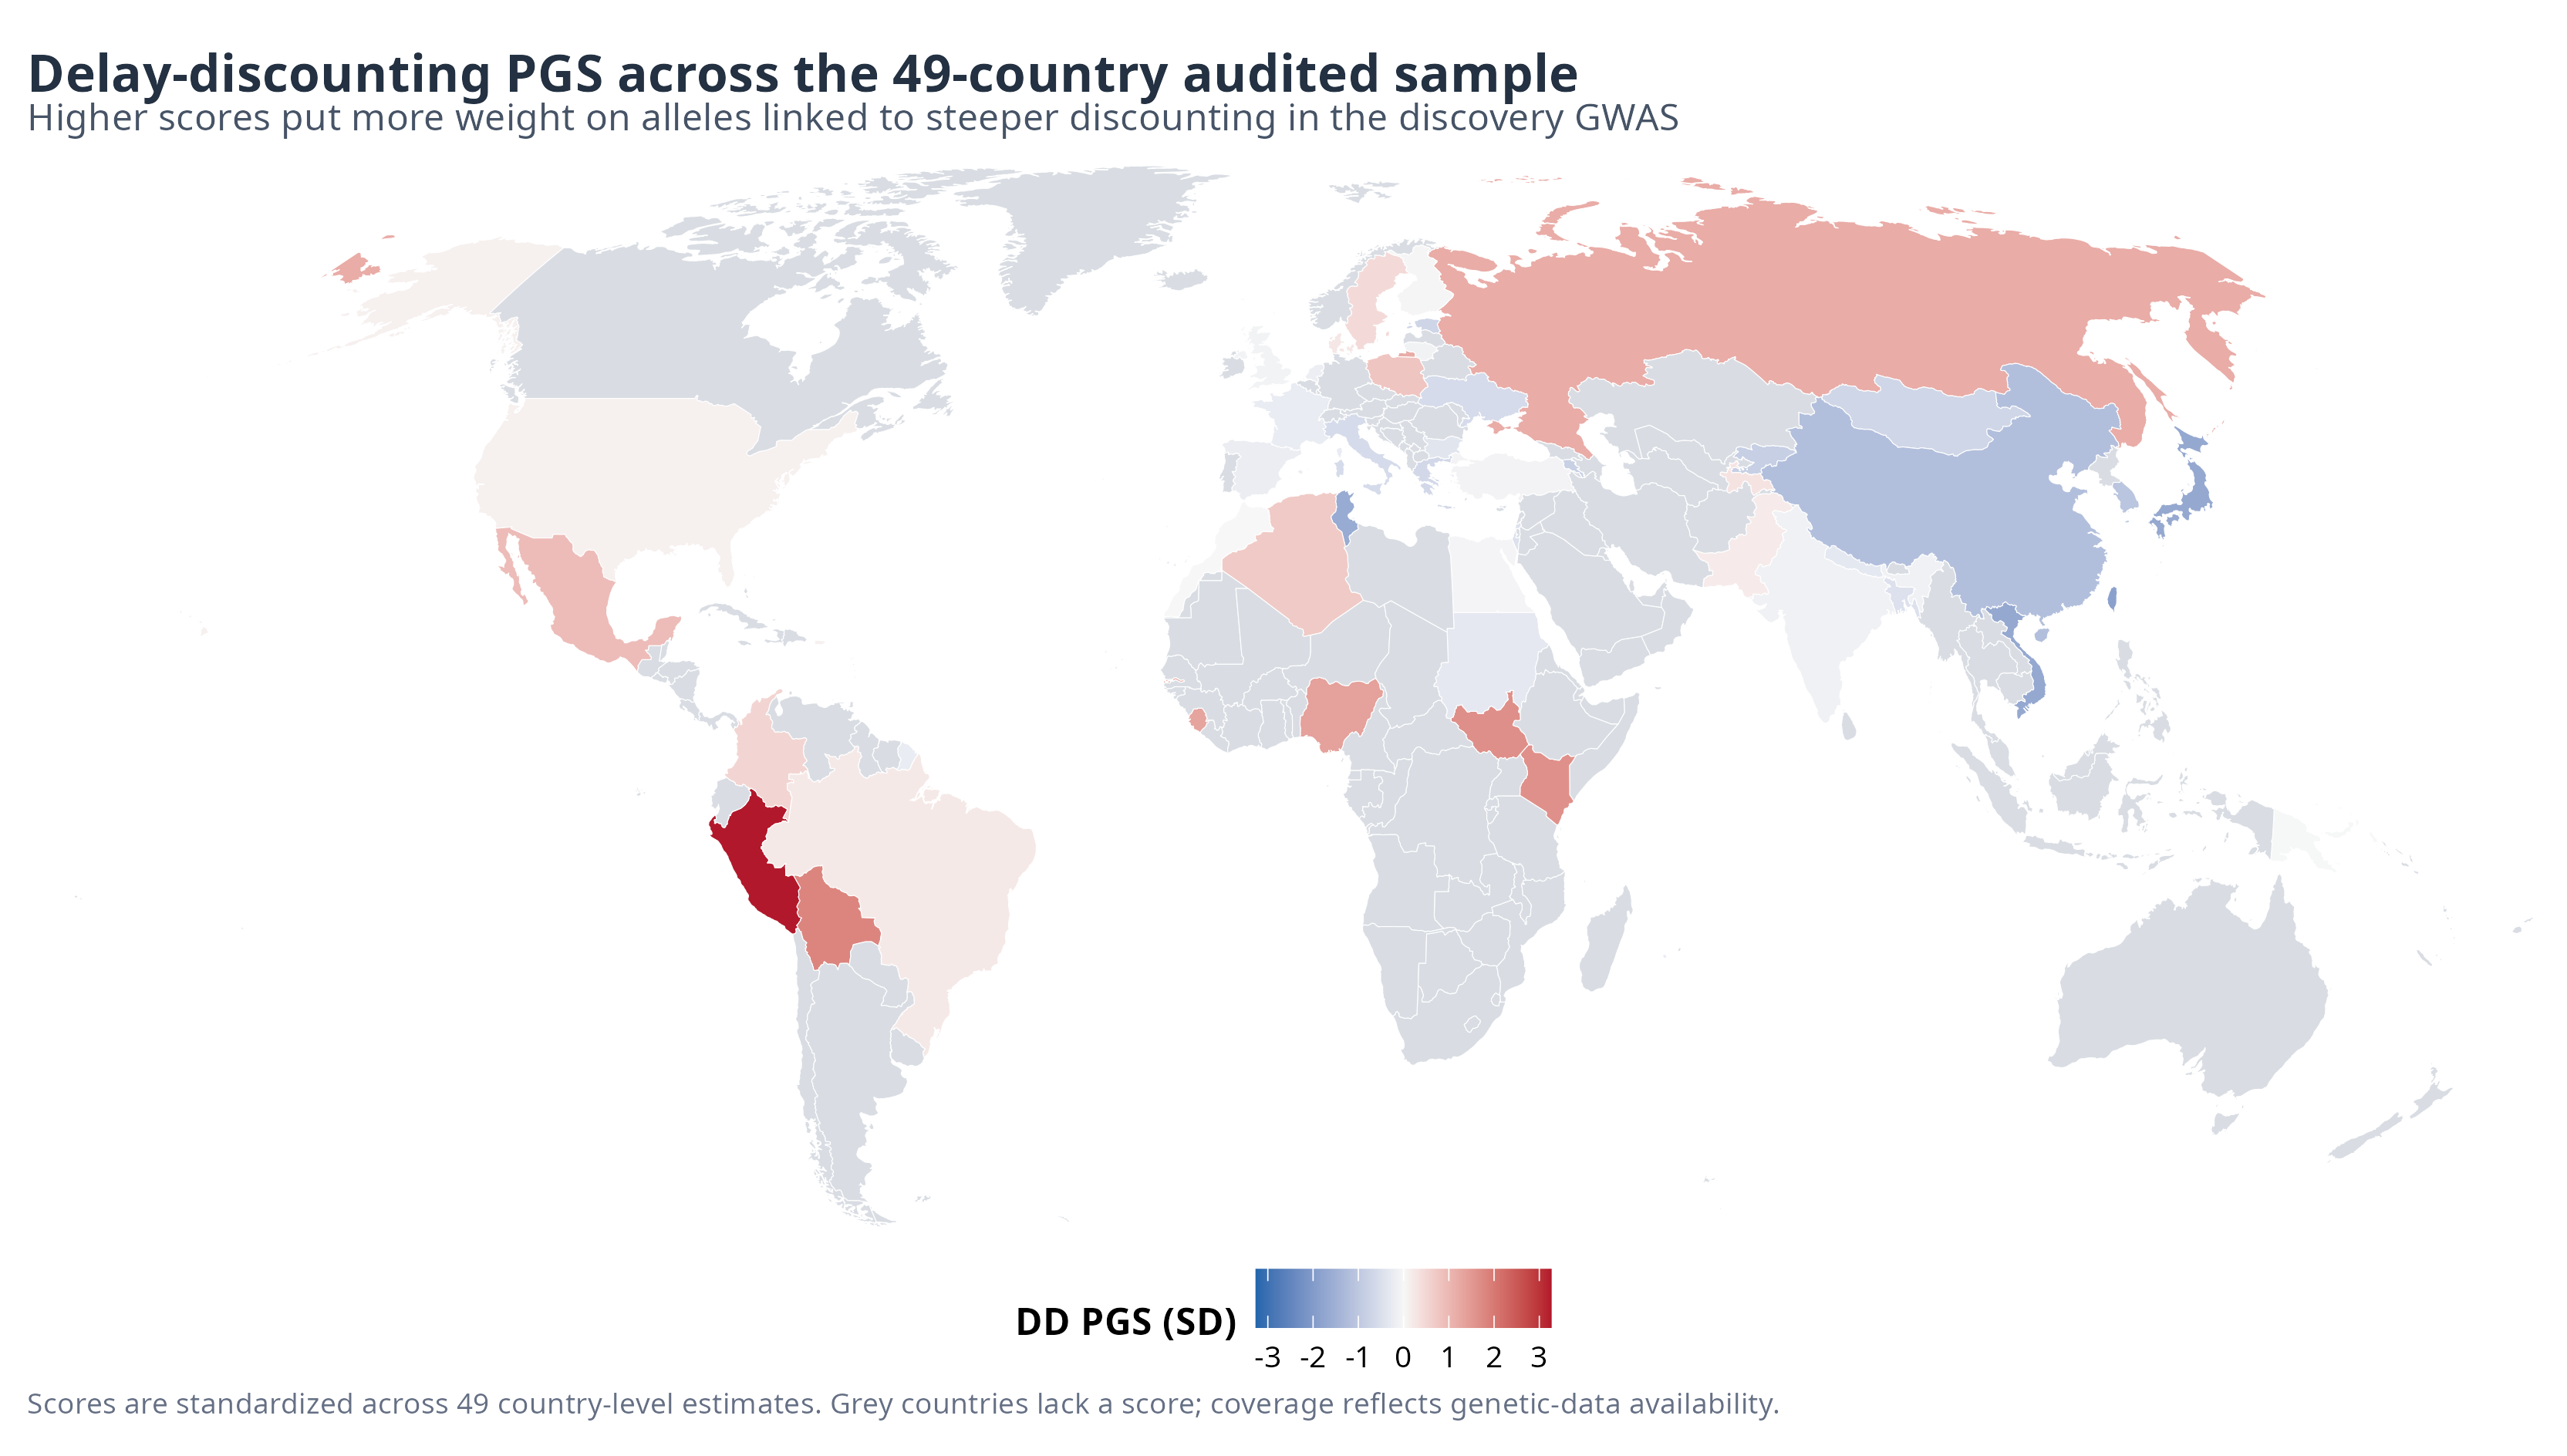
Figure 2 turns the map into a complete ranking: every one of the 49 country estimates is labeled and ordered from the highest to the lowest standardized DD PGS.
Figure 2. Standardized DD PGS for every country in the audited 49-country genetic sample.
Patience was measured in several different ways
The main behavioral benchmark is the Global Preferences Survey, which used standardized elicitation in representative samples from 76 countries. Its patience measure combines a staircase of hypothetical sooner-versus-later monetary choices with self-assessed willingness to wait (Falk et al., 2018; Sunde et al., 2022).
I also used the international compilation assembled by Rieger, Wang, and Hens (2021). It includes direct INTRA monetary choices, inferred long-run discount and present-bias parameters, a pace-of-life field index, World Values Survey long-term orientation, and GLOBE future-orientation practices and values. Their published UP-time index is itself a cross-study principal component. I report it as a benchmark but do not put it inside my own factor, which would double-count its component measures.
The distinction between direct and indirect measures is important. Choosing a later monetary payment is conceptually close to delay discounting. WVS and GLOBE measure broader cultural orientation. Agreement across them is interesting, but it does not mean they are interchangeable observations of one perfectly defined psychological trait.
The next question is whether the genetic score lines up with all nine measures, whether those measures can be summarized as one broader patience signal, and whether the pattern changes when we account for ancestry-related structure. Finally, I test whether this score is correlated to the educational attainment PGS.