PifferPilfer

PifferPilfer

When Low Heritability Means Different Things: Number of Children vs. Number of Fingers

Implications for the nature vs nurture debate and the portability of polygenic scores

Davide Piffer's avatar
Davide Piffer
Sep 03, 2025
∙ Paid
14
2
Share

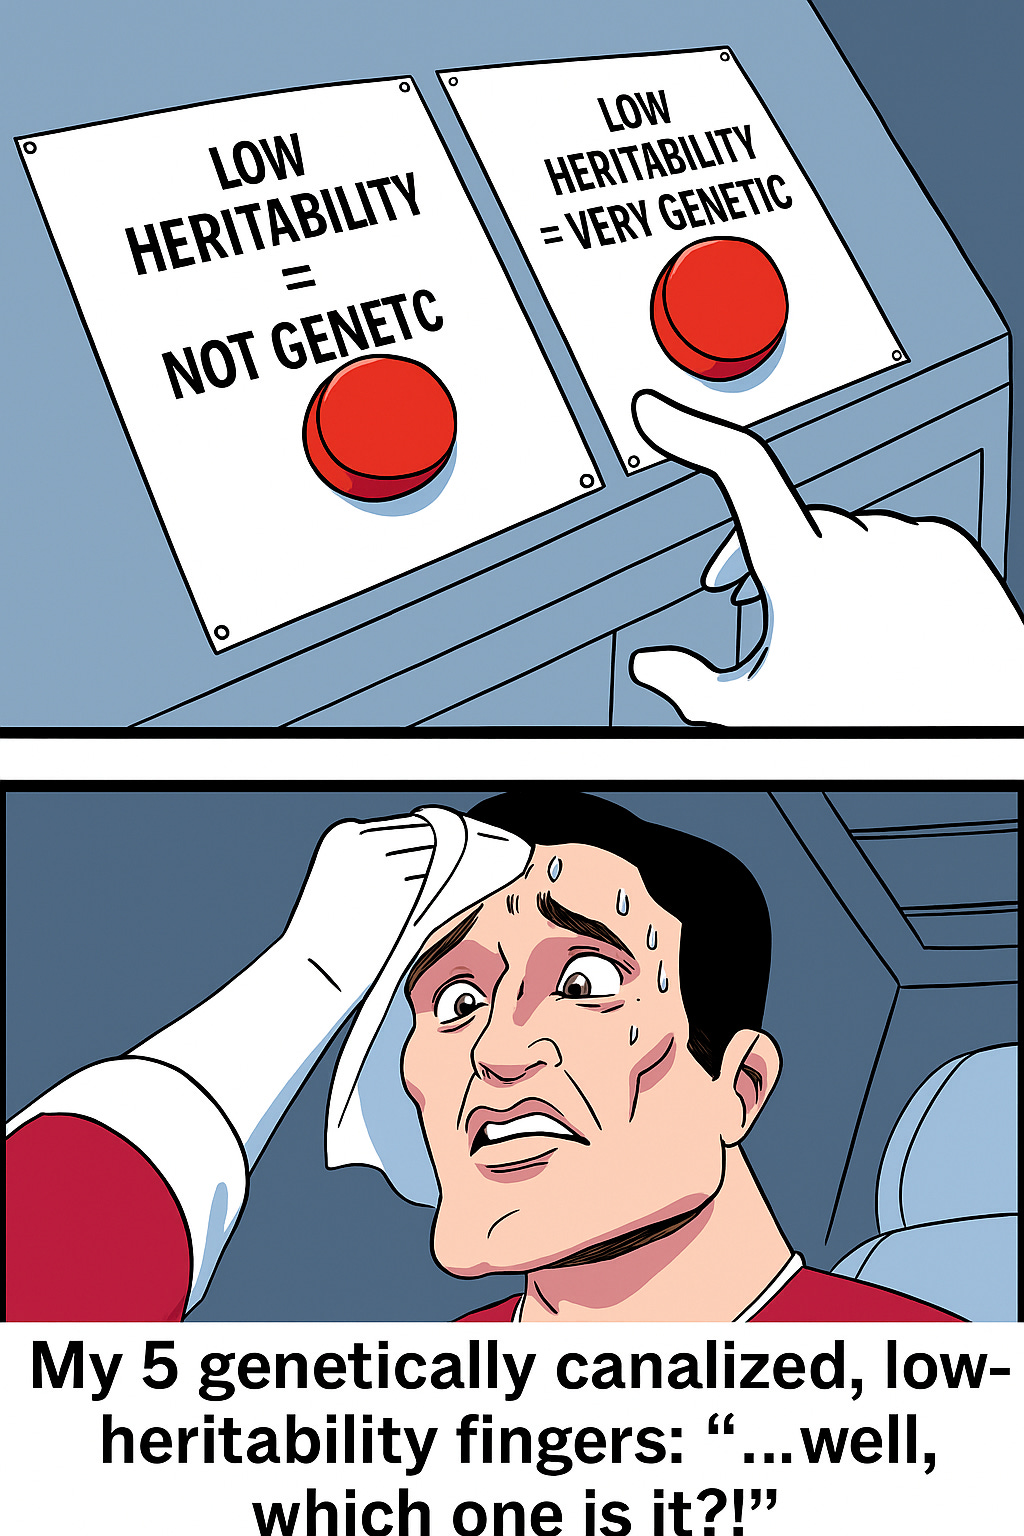
When we hear a trait has “low heritability,” it’s easy to assume it means “not genetic.” But heritability is a slippery concept: it doesn't measure how genetic a trait is, but how much of the variation in a trait, within a specific population, can be explained by genetic differences. Two starkly different examples show why this matters: the number of fingers people have, and the number of children they have.

Both appear to have low heritability on the surface, but they arrive at that point for completely opposite reasons. One is a story of genetic rigidity; the other, of genetic flexibility.

What heritability actually measures (and what the symbols mean)

  • h² (family/twin heritability): variance captured by family resemblance. Includes common + rare variants, non-additive effects (dominance/epistasis), and often some gene–environment correlation.

  • h²_SNP: variance captured by common, additive SNPs on genotyping arrays (GREML/LD-score models).

  • h²_GWAS: variance explained by the specific SNPs that achieve genome-wide significance (or PGS built from those hits).

  • Missing heritability: h² – h²_SNP.

  • Hidden heritability (Tropf et al. 2017): the portion of h²_SNP that is recovered when you model cross-population/cohort heterogeneity instead of pooling everything as if effects were identical.

Two pathways to “low heritability”:

  1. There’s almost no phenotypic variance (everyone is the same) → h² near zero even if biology is fully genetic.

  2. There is variance, but most of it is environmental or context-dependent, so genetics explains a smaller share.


📦 What’s a GWAS?
A genome-wide association study (GWAS) scans the genome of hundreds of thousands—or even millions—of people, testing each common genetic variant (SNP) to see if it correlates with a trait.

  • A SNP is called a hit if it passes a strict statistical threshold (p < 5×10⁻⁸).

  • These hits can then be combined into a polygenic score (PGS), which adds up their effects across the genome.

When I talk about h²_GWAS, I mean the variance in a trait explained by these genome-wide significant hits (or by a PGS built from them). It’s always smaller than h²_SNP, because most SNPs carry tiny signals that don’t clear the significance bar.

Number of fingers: the illusion of “non-genetic”

Almost everyone has ten fingers. Occasional mutations or accidents create exceptions, but they’re rare.

Why so uniform?

  • Strong stabilizing selection purged variants that disrupted five-digit development.

  • Developmental canalization makes the limb program robust to small perturbations.

Bottom line: finger number is profoundly genetic yet shows near-zero heritability (to be sure, this is not actually 0 because there are genetic mutations and some fingers can accidentally get chopped off unfortunately, but close enough) in most populations because there’s virtually no variance left to explain. Low h² here signals invariance and rigidity.


Number of children: low GWAS signal ≠ low genetics

Fertility is different. The number of children varies widely and is exquisitely sensitive to context. In earlier posts, I showed that within countries:

  • When GDP increases, fertility tends to decline.

  • When childhood mortality increases, fertility tends to rise, consistent with life-history trade-offs.

So there’s ample variance. Do genes matter? Yes, but the way they show up depends on the method:

  • Family/twin h²: typically ~30–50% for number of children (NEB) and age at first birth (AFB) (cohort dependent).

  • h²_SNP: lower but meaningful, often ~10–13% for NEB when modeled carefully.

  • h²_GWAS: tiny (often ~1–4%) because few SNPs show consistent, homogeneous effects across cohorts to pass genome-wide significance.

That stack looks like this:

h² (family/twin) ≈ 30–50%
↓
h²_SNP ≈ 10–13%
↓
h²_GWAS ≈ 1–4%

The gaps reflect rare variants and non-additive effects, gene–environment correlation, and - critically - heterogeneity across populations and cohorts. When gene×population/cohort is modeled explicitly, SNP heritability for fertility jumps, with Tropf et al. estimating hidden h² of ~40% for AFB and ~75% for NEB.


Hidden heritability: when pooling washes out real genetic signal

Large GWAS pool many countries and birth cohorts, implicitly assuming SNP effects are the same everywhere. That’s a bad assumption for social traits.

Tropf et al. (2017) showed that for reproductive behavior (NEB, AFB) and related traits, genetic effects differ across populations and cohorts. If you pool naively:

  • h²_GWAS shrinks (conflicting effects mean fewer consistent hits).

  • h²_SNP (pooled) can also shrink (across-cohort genetic covariance is lower than within-cohort covariance).

When they model heterogeneity (allow gene×population/cohort), h²_SNP jumps - for NEB, they report that a large share (by as much as 75%) of the SNP-heritability was hidden by pooling and is recovered once heterogeneity is allowed. In short: the genes matter, but their effects are context-dependent.

I read this gap: h² – h²_SNP and the portion of h²_SNP recovered by modeling heterogeneity, as a proxy for gene–environment interaction and correlation in fertility.

The remainder of this piece is for paid supporters, where I dig into hidden heritability and what it means for polygenic scores.

This post is for paid subscribers

Already a paid subscriber? Sign in
© 2025 Davide Piffer
Privacy ∙ Terms ∙ Collection notice
Start writingGet the app
Substack is the home for great culture