
Who Are the “Purest” Europeans?
Separating admixture from isolation

Some readers recently asked me a simple question: who are the “whitest” Europeans?
Not in the literal sense of skin colour, but in the genetic sense of which populations are the most “typical”, or the least affected by external admixture.
The intuitive way to answer this is to look at a PCA plot. Populations that cluster tightly and sit at the “core” of Europe might seem more “pure”, while those drifting toward other regions might appear more admixed.
But this approach has a flaw.
PCA plots are low-dimensional summaries of a much higher-dimensional structure. Most of the genetic variation is compressed into just two axes, and distances in that space can be misleading. Two populations that look close in a 2D plot may differ substantially once additional components are considered.
Even if we tried to formalize this approach — for example, by measuring how far individuals sit from their population centroid — we would still run into arbitrary choices: how many components to include, how to weight them, and what exactly counts as “central”.
PCA is useful for visualization, but it is not a reliable way to quantify how “pure” a population is.
A better starting point: genetic distance
A more direct approach is to use genetic distances.
Here I use FST, computed on the modern subset of the AADR dataset, to measure how different populations are from each other. For each European population, I calculate two quantities: its average genetic distance to other Europeans, and its average distance to a set of non-European outgroups (African, East Asian, South Asian, Central Asian, and Siberian).
At first glance, this seems like exactly what we need. If a population is far from all non-European groups, we might be tempted to call it “pure”.
And indeed, if you rank populations by their distance to non-Europeans, the familiar names appear at the top: Sardinians, Basques, and island populations like Orcadians.
Isolation inflates everything
Populations that are genetically isolated within Europe are also further from the rest of the world. Isolation inflates genetic distance in all directions. A group that has drifted away from other Europeans will automatically look more distant from Africans, East Asians, or South Asians, even if it has not experienced less external admixture.
This becomes clear when you plot the two quantities against each other:
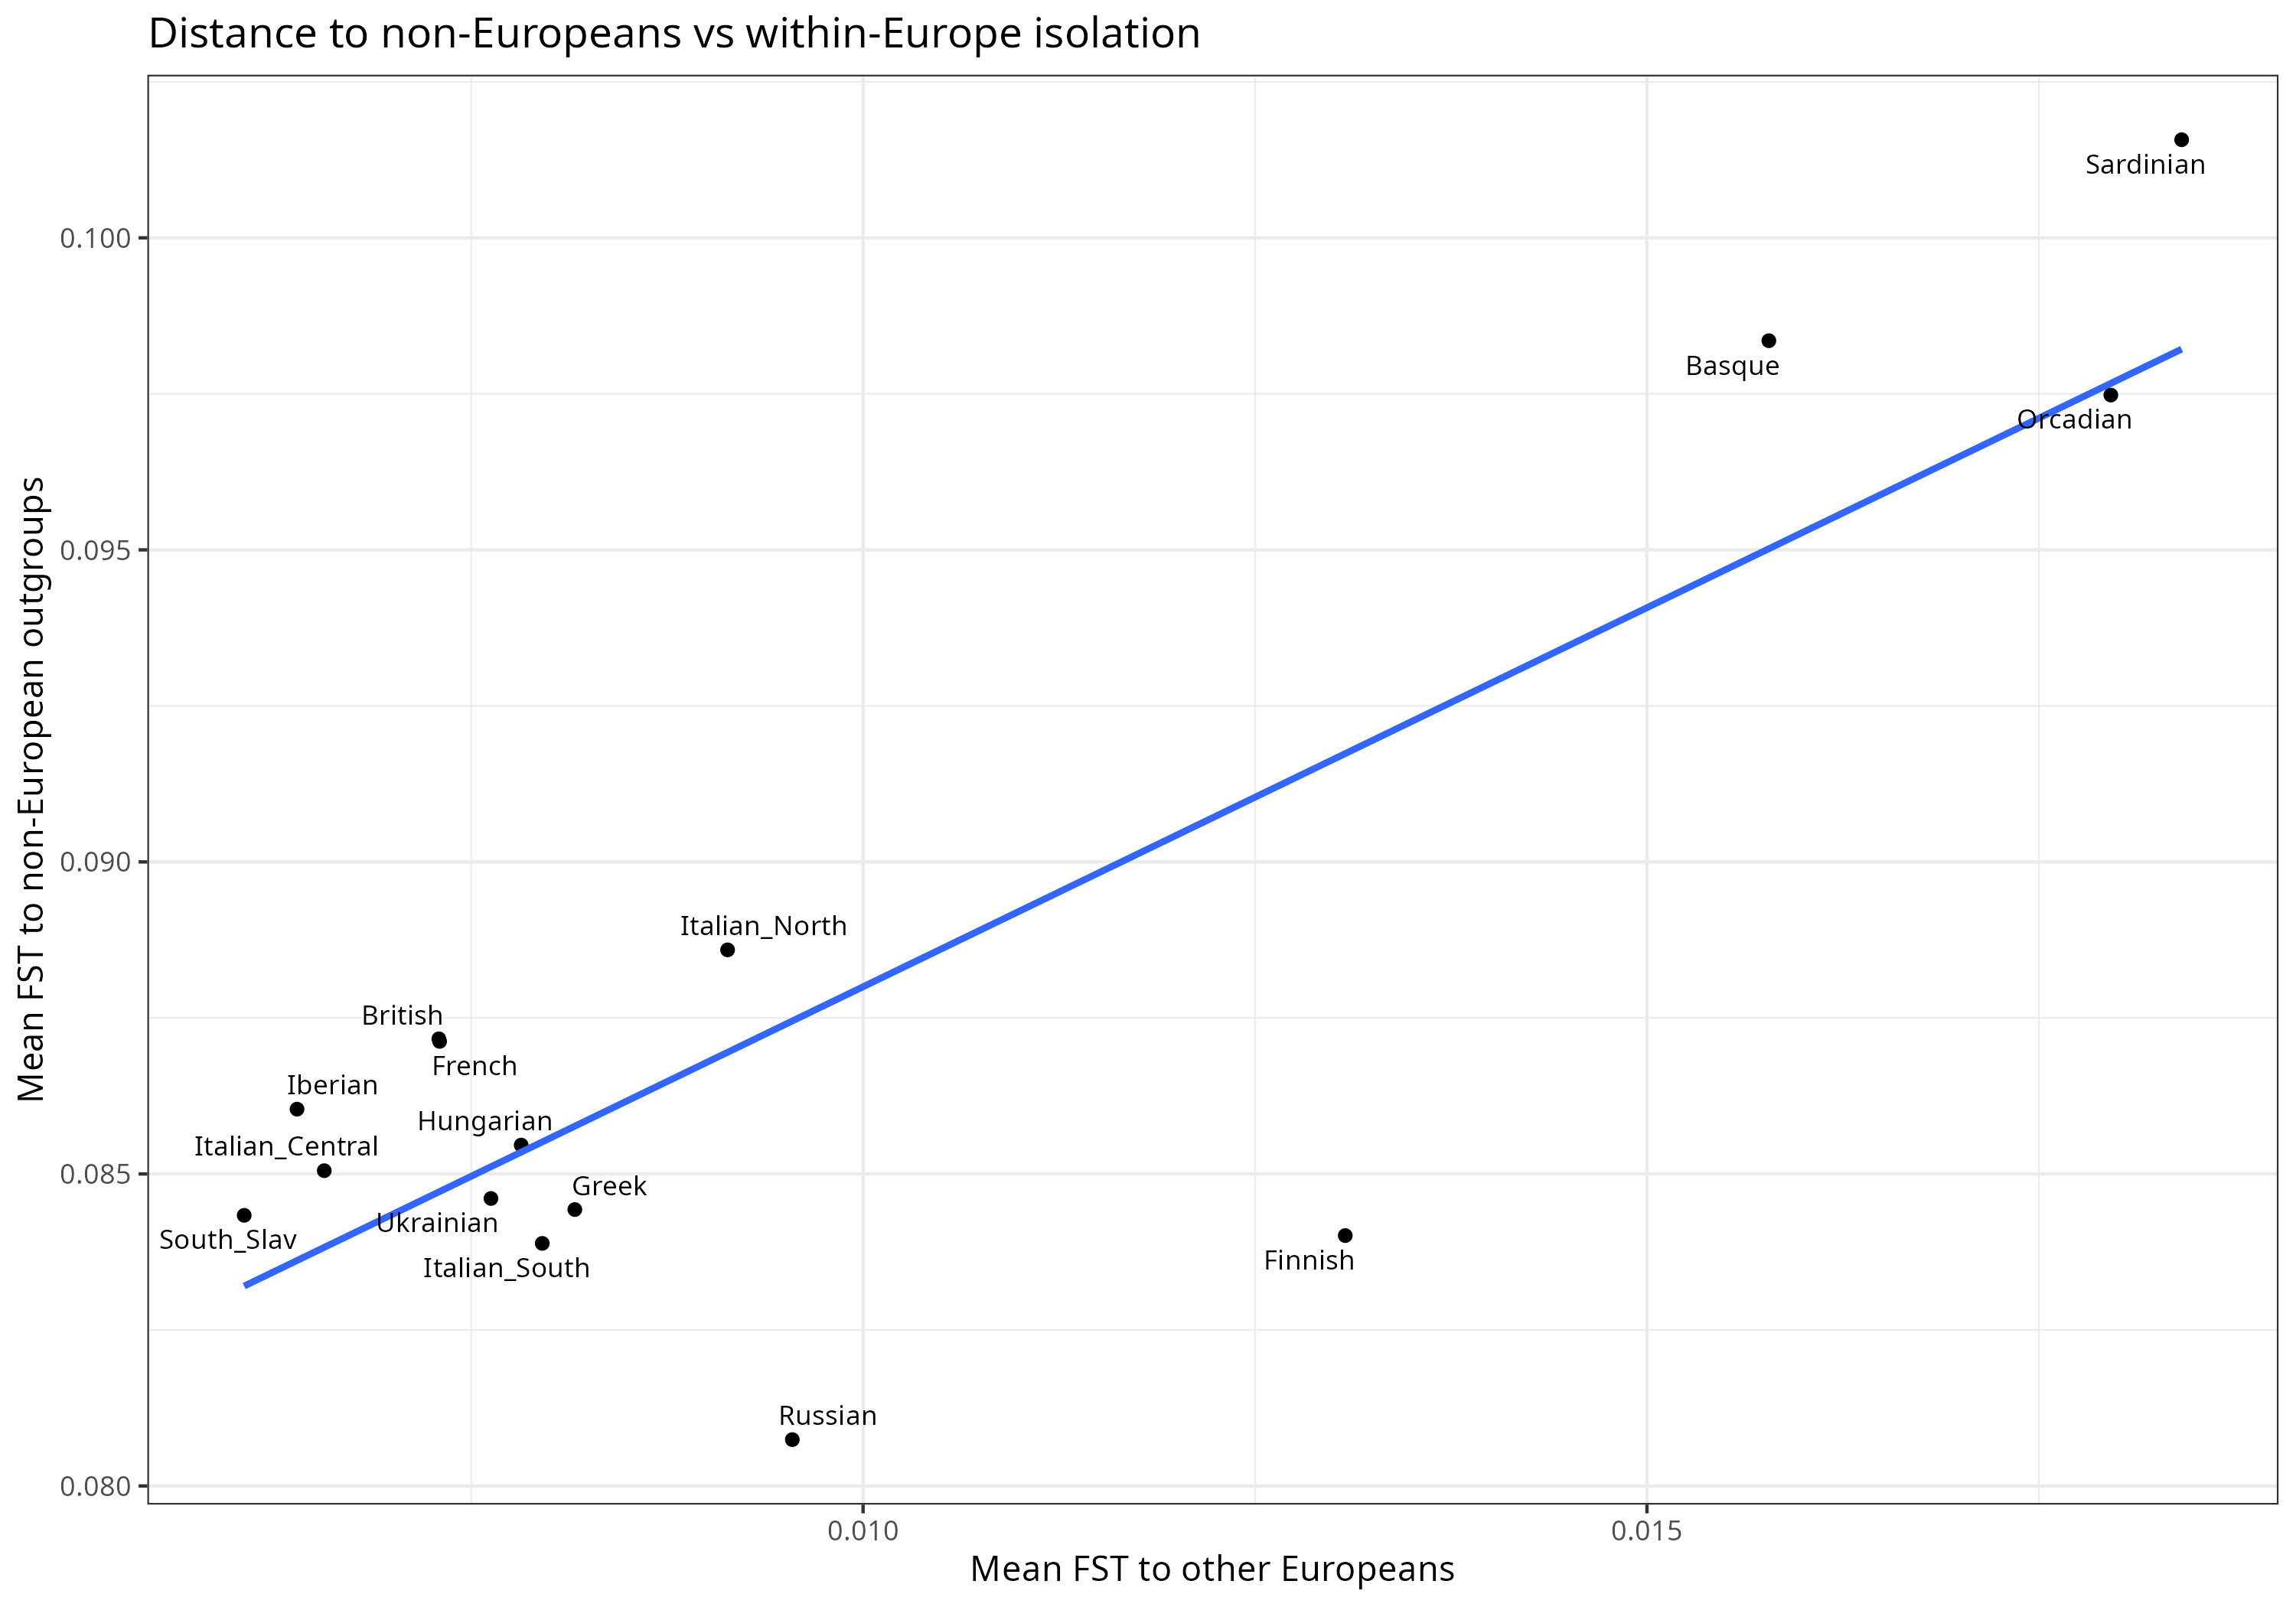
There’s a very tight relationship between the two. Populations that are far from the rest of Europe are also far from non-European groups.
Sardinians, Basques, Orcadians all end up in the same corner. Not just far from the outside world, but far from other Europeans too. Mainland populations sit much closer together.
At that point the ranking stops being very informative. If a population is more isolated, it will look more distant from everything.
So just taking distance to non-Europeans and calling that “purity” doesn’t really work. It’s mixing two different things.
The question then becomes how much of that distance is just isolation, and how much reflects actual connections outside Europe.