
Why Some Provinces Do Better in School (and Math Olympiads): The Answer Is Written in Their Surnames

What can your surname tell you about where your family comes from, and how does that connect to school performance in Italy today?
In a new article (Piffer et al., 2025), my coauthors and I use surnames as a window into Italy’s demographic past. By tracking where surnames are historically most common, we build a map of paternal ancestry across Italian provinces and municipalities, and then connect that map to standardized test scores and Mathematical Olympiad results.
Three main points emerge:
Italian surnames provide a useful proxy for paternal ancestry.
Areas with more Southern-origin surnames tend to have lower academic performance, even after accounting for economic differences.
Surname-inferred ancestry also predicts Mathematical Olympiad performance at the aggregate level, not just average school scores.
Below I walk through how we did this and what we found.
Surnames as a window onto paternal ancestry
Italian surnames are inherited from the father. Many of them are strongly linked to specific regions. For example, Esposito is heavily concentrated in Campania, while surnames like Ferrari or Ferrero are more typical of the North. This regional “accent” in surnames allows us to treat them as markers of paternal geographic ancestry.
The starting point for the paper is a large database of surname frequencies across all Italian provinces and over 2,000 municipalities. Instead of simply counting how often each surname appears, we adapt a tool from text mining known as TF–IDF (term frequency–inverse document frequency).
In text analysis, TF–IDF highlights words that are distinctive for a given document, rather than words that appear everywhere. We treat:
Surnames as “terms”
Provinces as “documents”
Imagine you want to decide which surnames best “diagnose” that someone comes from Campania and which best diagnose Piedmont.
A naïve approach would be to take the most common surnames in each region. This fails because the most common surname in almost every Italian region is Rossi (or a variant). Rossi is everywhere, so it tells you nothing about regional origin.
TF–IDF fixes this in two steps:
Term Frequency (TF): How common is surname X in region A? (e.g., Esposito is very common in Campania)
Inverse Document Frequency (IDF): How rare is surname X across all regions? (Esposito is extremely rare outside the South → high IDF score; Rossi is common everywhere → low/zero IDF score)
Multiply TF × IDF and you get a high score only for surnames that are both frequent in one place and rare elsewhere. Common national surnames (Rossi, Russo, Bianchi) are automatically down-weighted to almost zero. This is why the method works so well in Italy, where many surnames are highly localized.
Since surnames are patrilineal, what we are really estimating is a paternal ancestry mix for each province and municipality.
Figure 1 shows how strong the “Southern” component is in each province based on surnames. Darker shading indicates a higher share of surnames that look Southern in origin. The northernmost province, South Tyrol, appears in grey because its predominantly German-speaking population does not fit the Italian surname patterns used in the analysis.
Figure 1
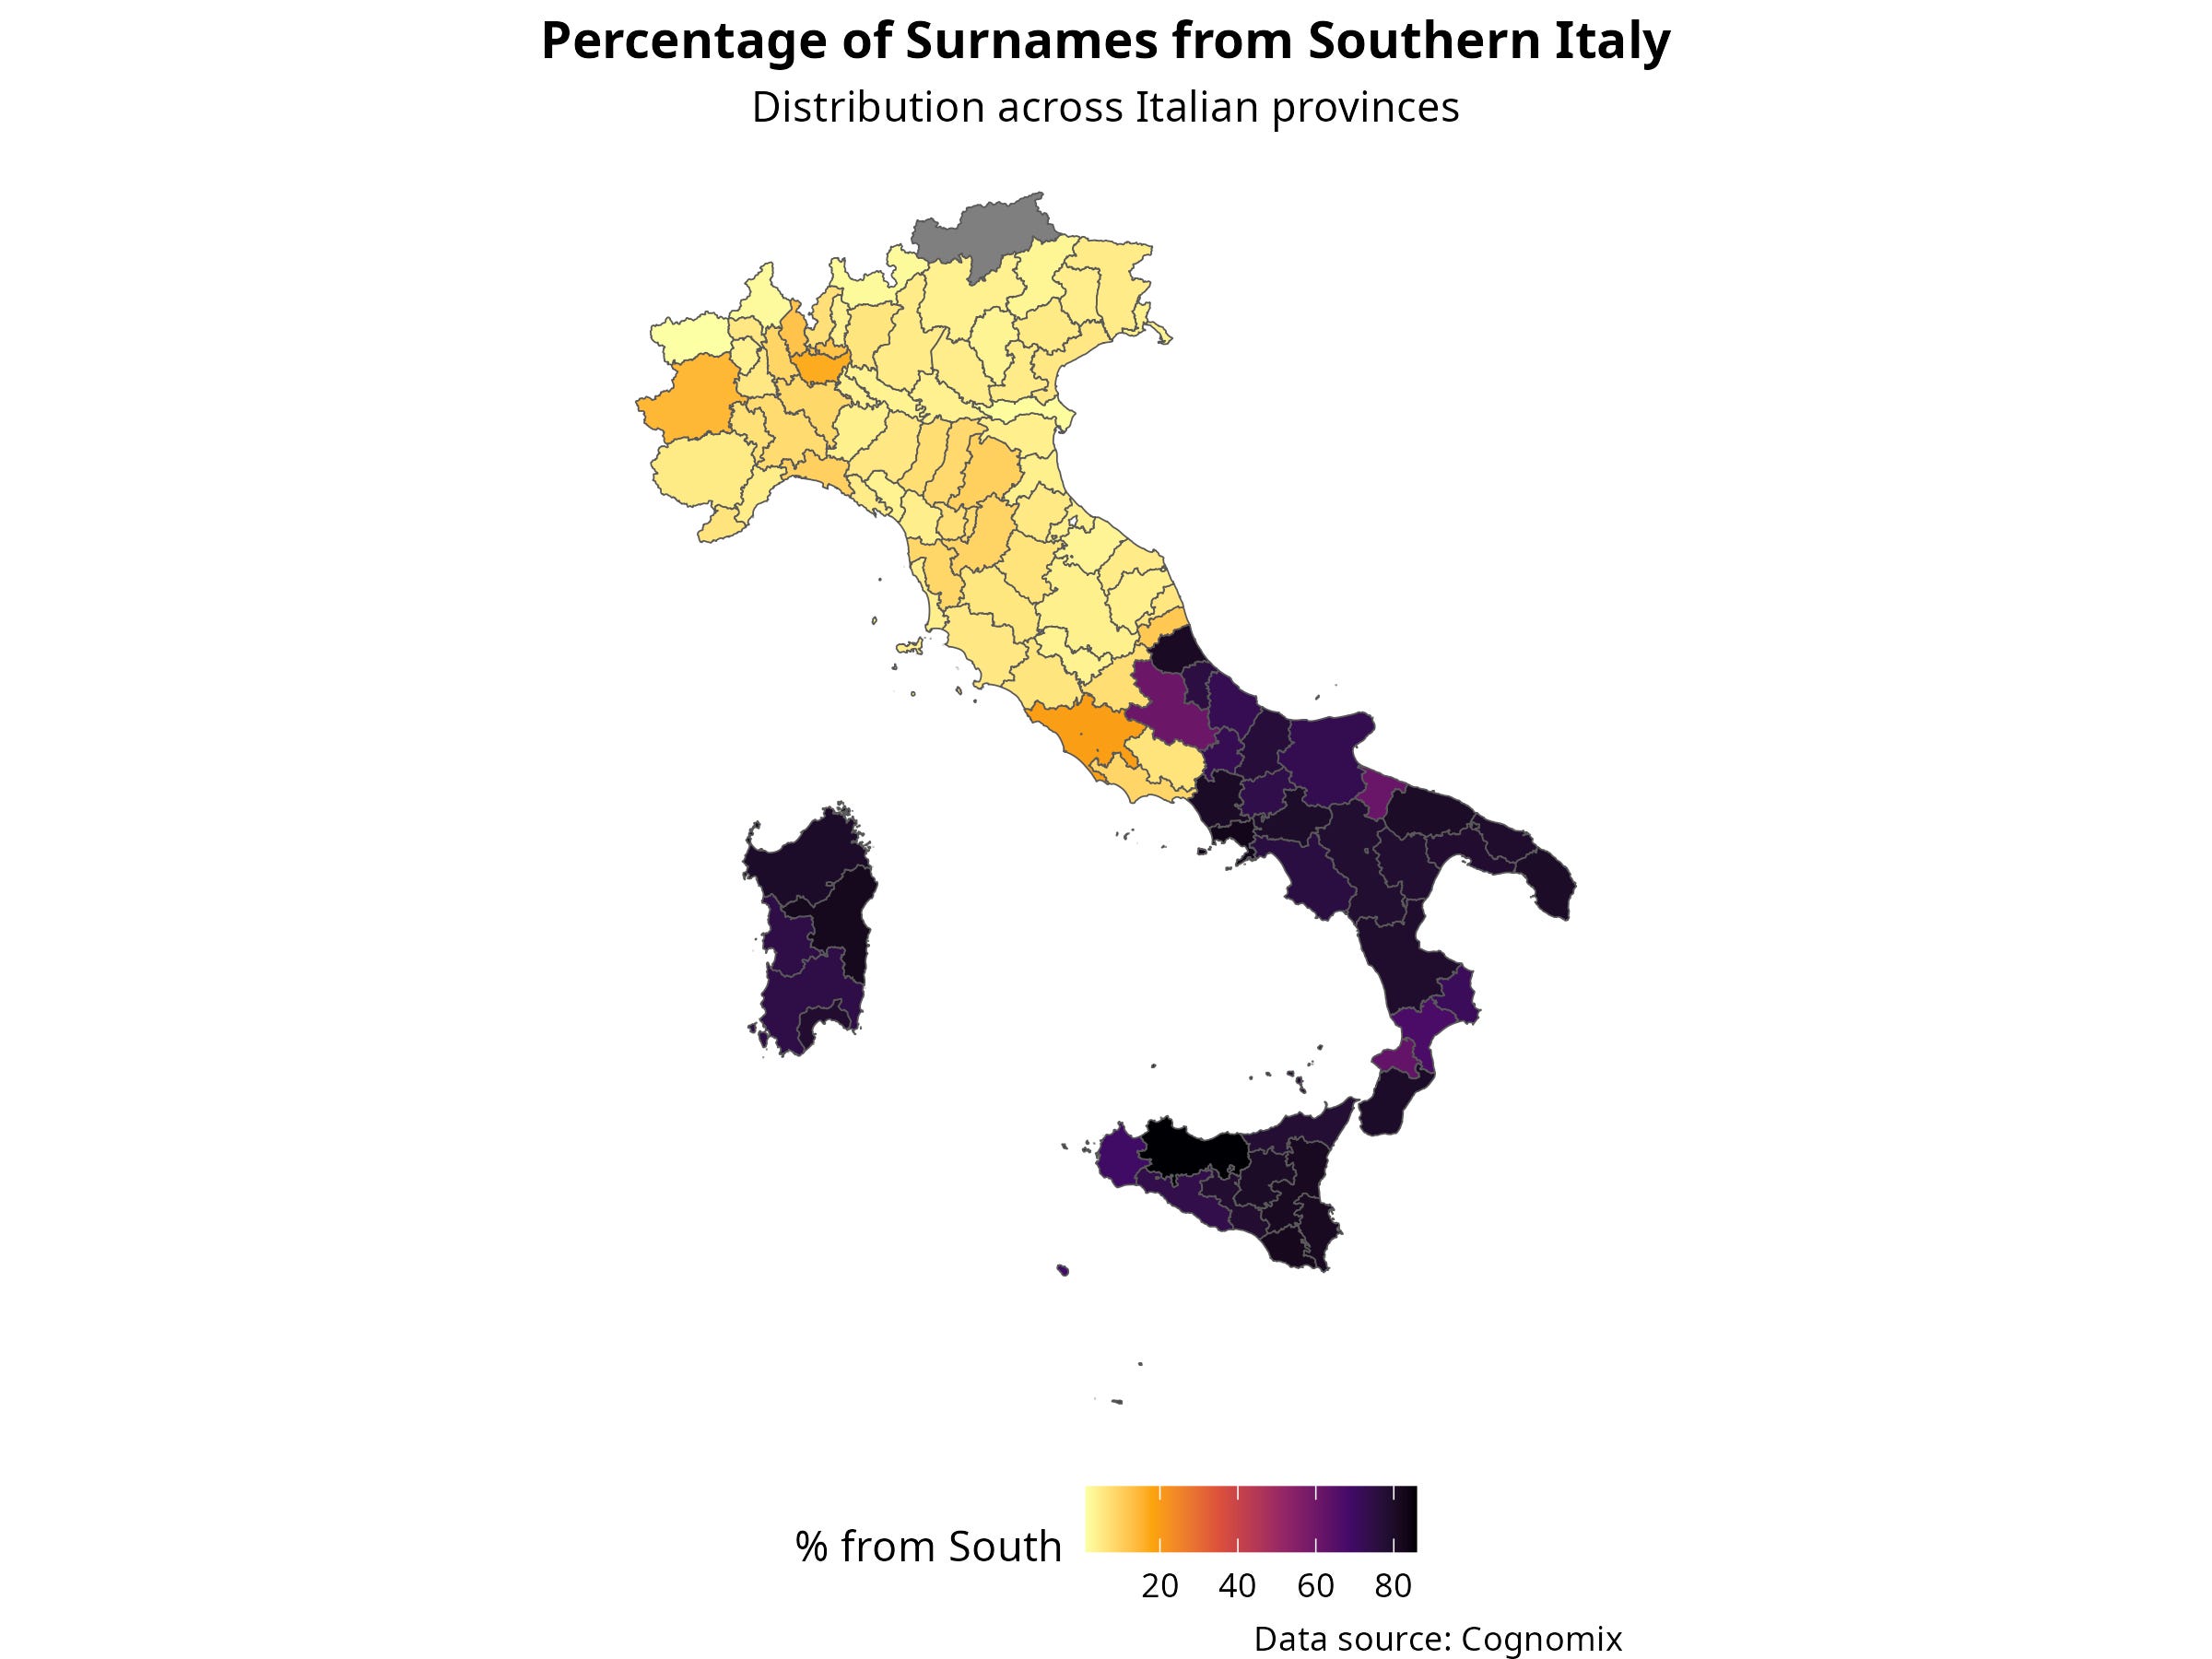
Figure 2 shows the same type of map but with a higher resolution, at the level of “comuni” (municipalities).
Figure 2.
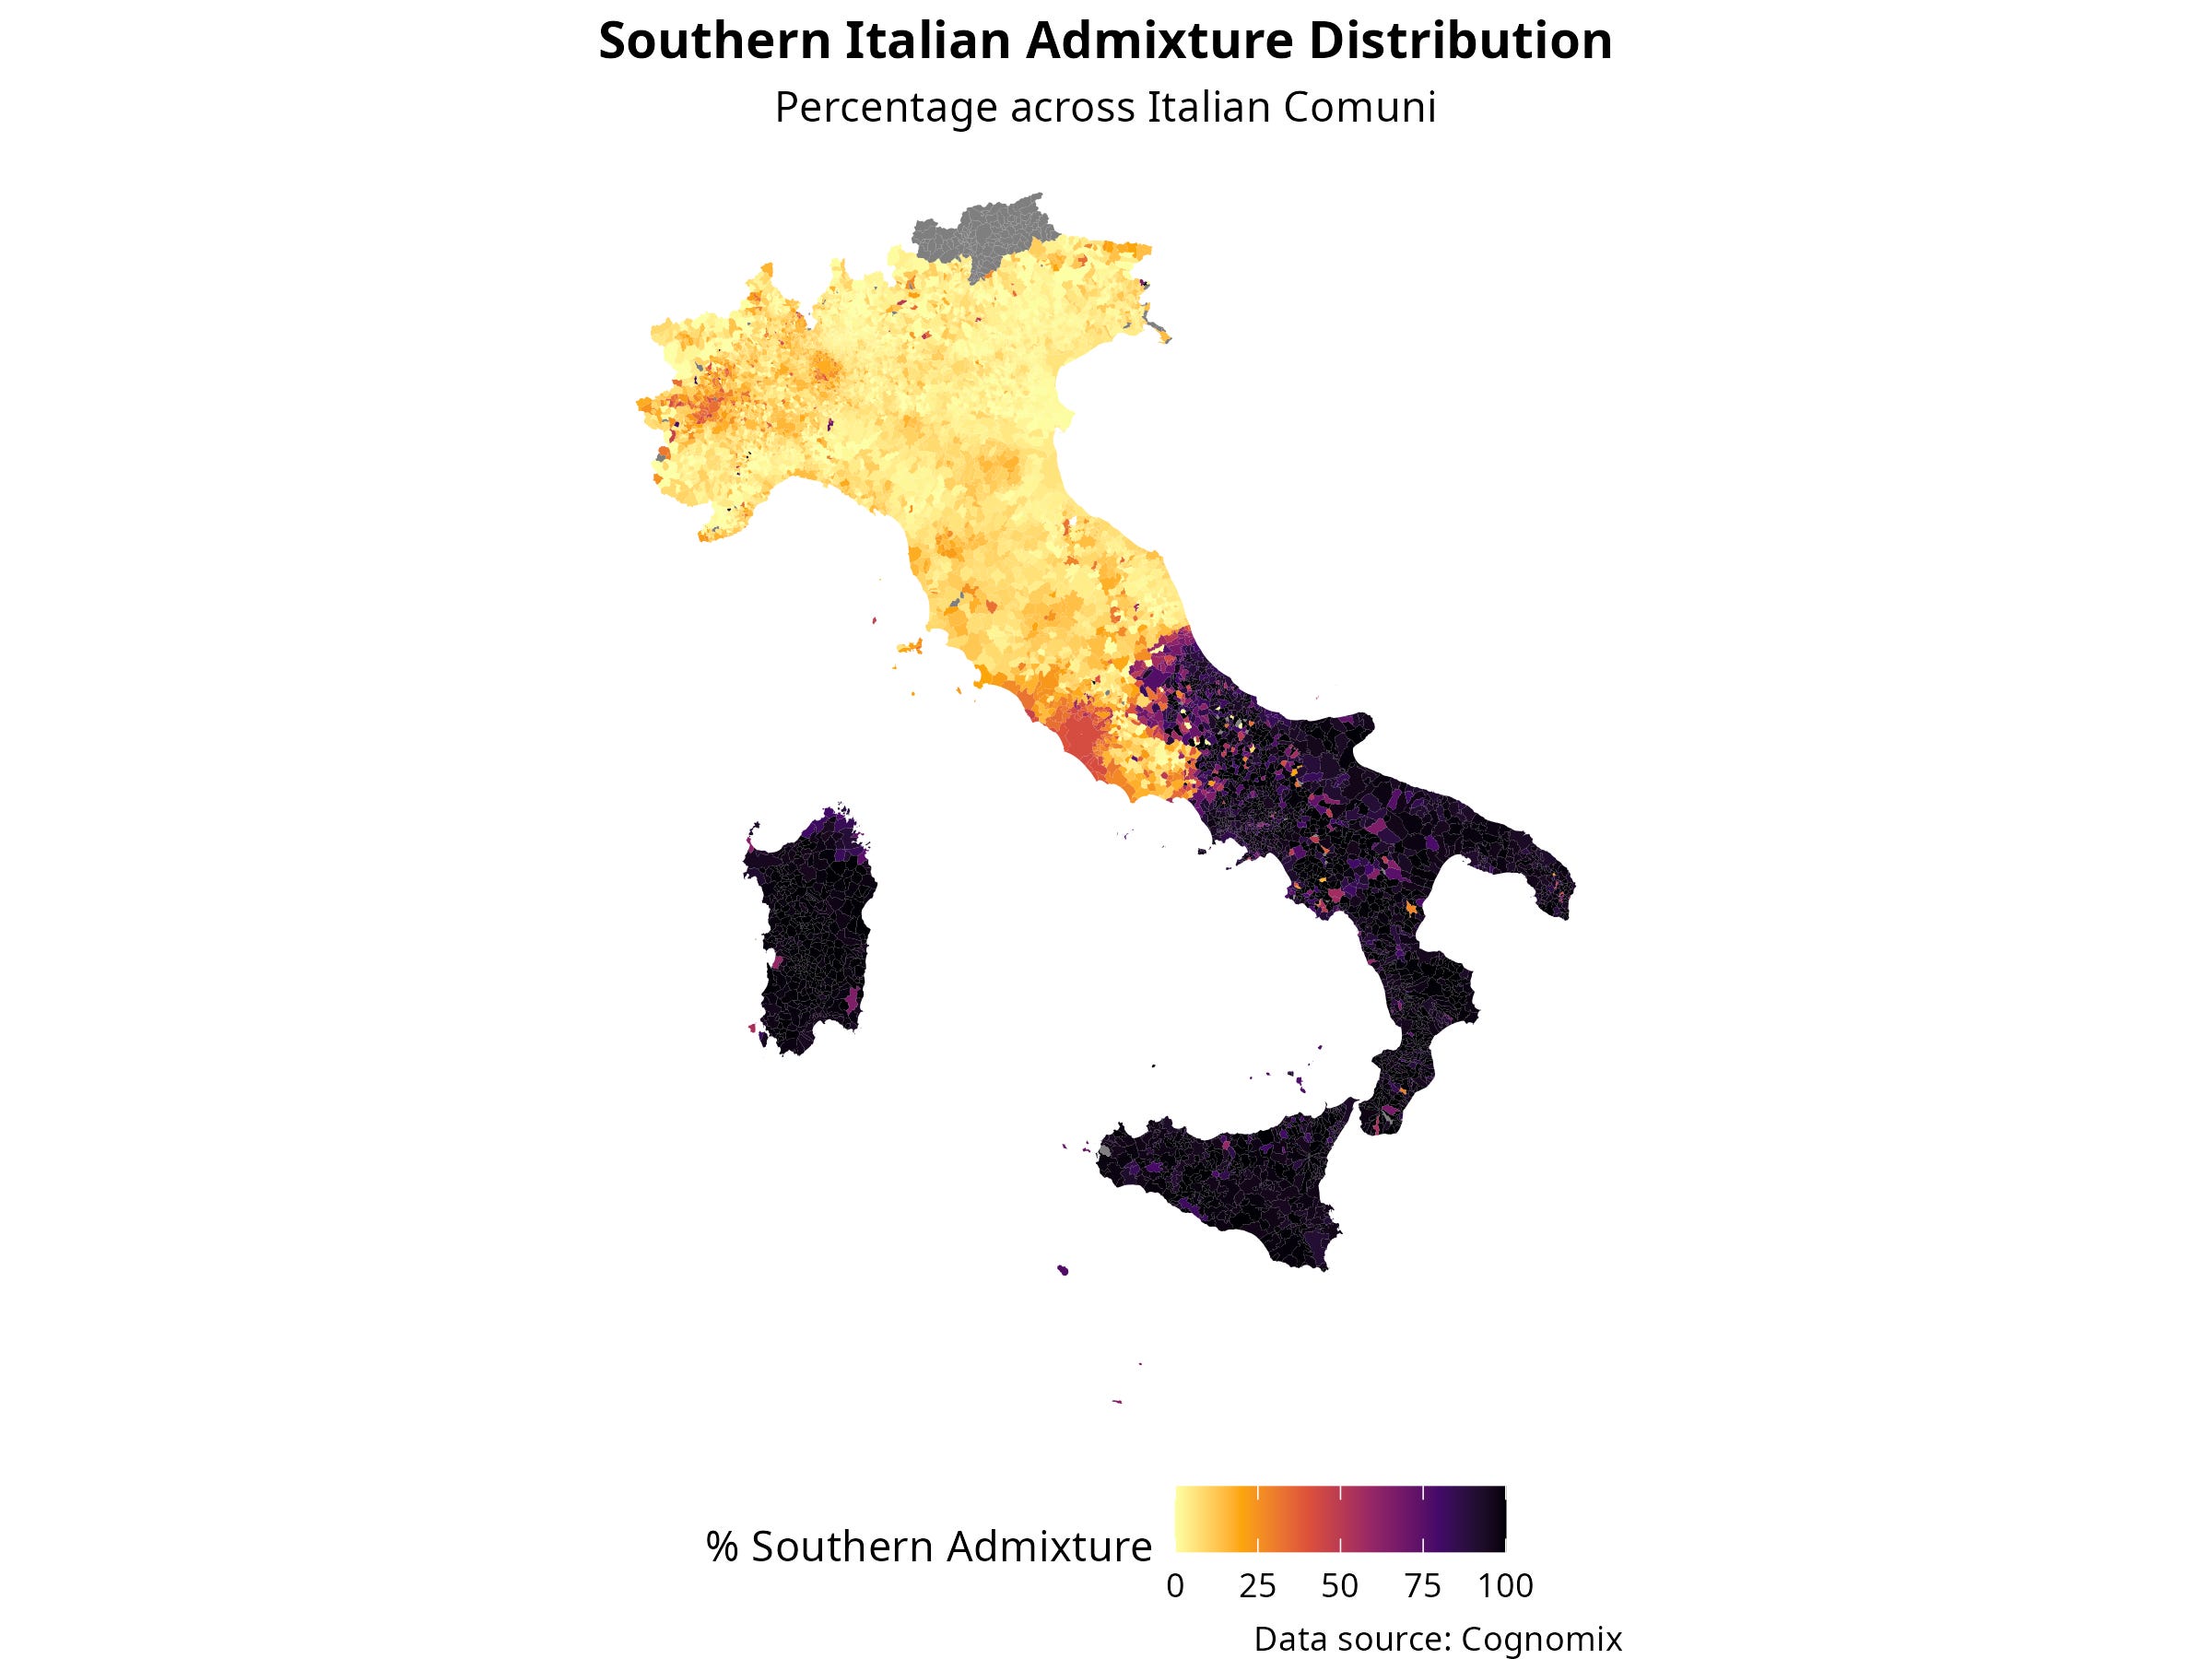
Outside of the south, one can see a higher % of southern surnames in large northern cities such as Milan and Turin and in the capital, Rome.
Southern ancestry and the North–South gap in school performance
Italy is famous for its North–South differences in education and development. INVALSI, the national standardized testing system, consistently shows that students in the North perform better on average than those in the South.
Our question is whether surname-based ancestry can help explain these differences, over and above standard economic indicators.
Provincial results
At the provincial level, we find a strong negative relationship between the share of Southern-origin surnames and the average standardized test performance of the natives (thus excluding first and second generation immigrants). Provinces with more Southern surnames tend to have lower test scores.
The correlation between Southern surname prevalence and educational outcomes is very large and negative.
In simple regression models, a higher Southern surname share predicts lower provincial test scores.
After adding controls for regional dummies and provincial economic output (per capita added value), the Southern surname variable remains a significant negative predictor.
In standardized units, a one standard deviation increase in Southern surname admixture corresponds to roughly half a standard deviation decrease in test performance. That is a substantial effect at the provincial level.
To give a more concrete sense of the provincial-level regressions, the table below summarizes the main models that relate Southern surname admixture and economic variables to INVALSI mathematics scores.
Table 1. Relationship between Southern surname admixture and provincial INVALSI mathematics scores (standardized coefficients)
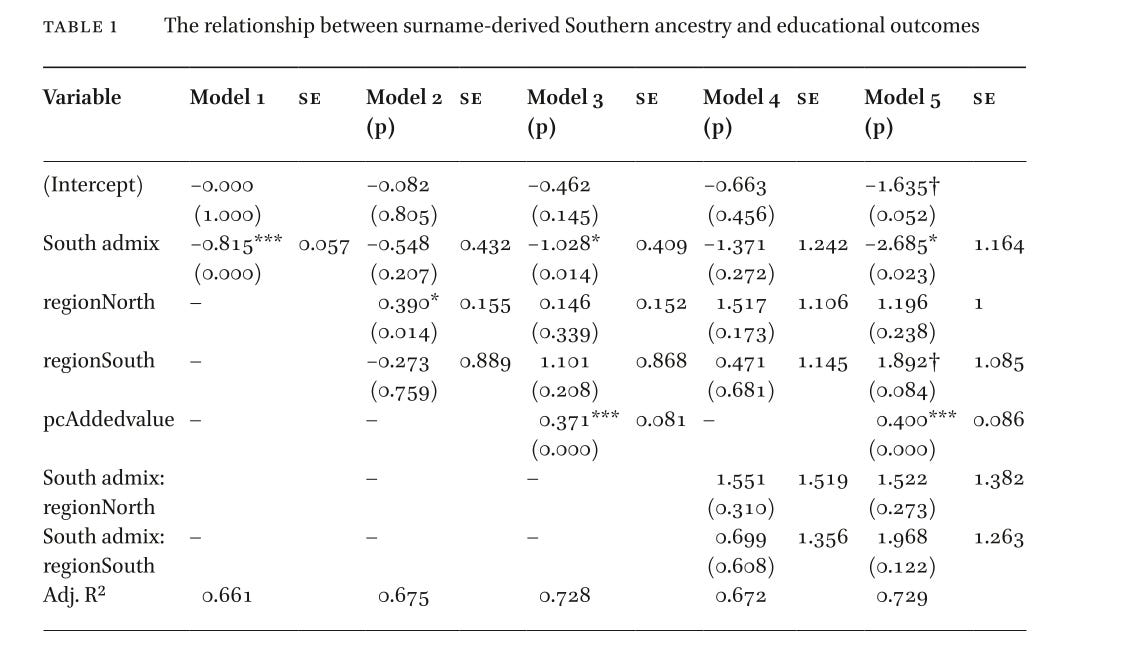
Model 1 shows a strong negative association between Southern surname admixture and provincial test scores when considered on its own. Model 2 adds regional dummies, which capture average differences between North, Center, and South. Model 3 then adds an economic control, per capita added value. In this last model, higher GDP is associated with higher scores, as expected, but Southern surname admixture still predicts lower performance and remains statistically significant.
In plain language, even among provinces that have the same current wealth, the ones whose population has more Southern male-line ancestry still have markedly lower average test scores.
The adjusted R² around 0.73 indicates that these variables together explain a large part of the variation in provincial educational outcomes.
Latitude and continuous geography
We also construct geographic measures based on surnames. Instead of just assigning provinces to North, Center, or South, we compute weighted average latitudes of their surname origins. Provinces whose surnames mainly trace back to northern areas have a higher “source latitude.”
Instead of classifying every surname as “Northern / Central / Southern” (three crude boxes), we assigned each distinctive surname the geographic latitude of the province where it is most characteristic. Then, for any town or province today, we computed the average latitude of all of its distinctive surnames, weighted by how strong each surname signal is. Result: a single continuous number (e.g., a town in Abruzzo might have an average surname-origin latitude of 41.5 °N, a town in Lombardy 45.0 °N).
These latitude measures turn out to be very powerful:
Mean source latitude predicts educational outcomes strongly and positively.
Overall weighted latitude explains a very large share of the variance in test scores.
This continuous “surname-source latitude” explains educational outcomes better than the traditional North–Centre–South classification because:
It captures subtle gradients (e.g. northern vs southern Emilia-Romagna)
It automatically handles mixed-ancestry places (big cities)
It lines up almost perfectly with the actual north–south performance gradient on a map
In other words, when you look at the geographic origins of surnames, you see a continuous gradient rather than a simple three-way regional split. Provinces whose surnames point northwards tend to perform better on standardized tests, even when they are not located in the extreme North in administrative terms.
Municipal results: the same pattern at finer resolution
The surname approach is not limited to provinces. We also apply it to more than 2,000 municipalities, which allows for much finer geographic detail.
The basic pattern repeats:
Municipalities with higher Southern surname prevalence tend to have lower educational scores.
This holds even after we add regional dummies and per capita income.
Per capita income is, as expected, a strong positive predictor, but it does not eliminate the surname effect.
Across a range of models, the coefficient on Southern surname prevalence remains negative and statistically significant. Its magnitude is smaller than at the provincial level, but still meaningful.
This suggests that the ancestry signal we see in surnames is not an artifact of a particular administrative level. It appears consistently at both provincial and municipal scales.
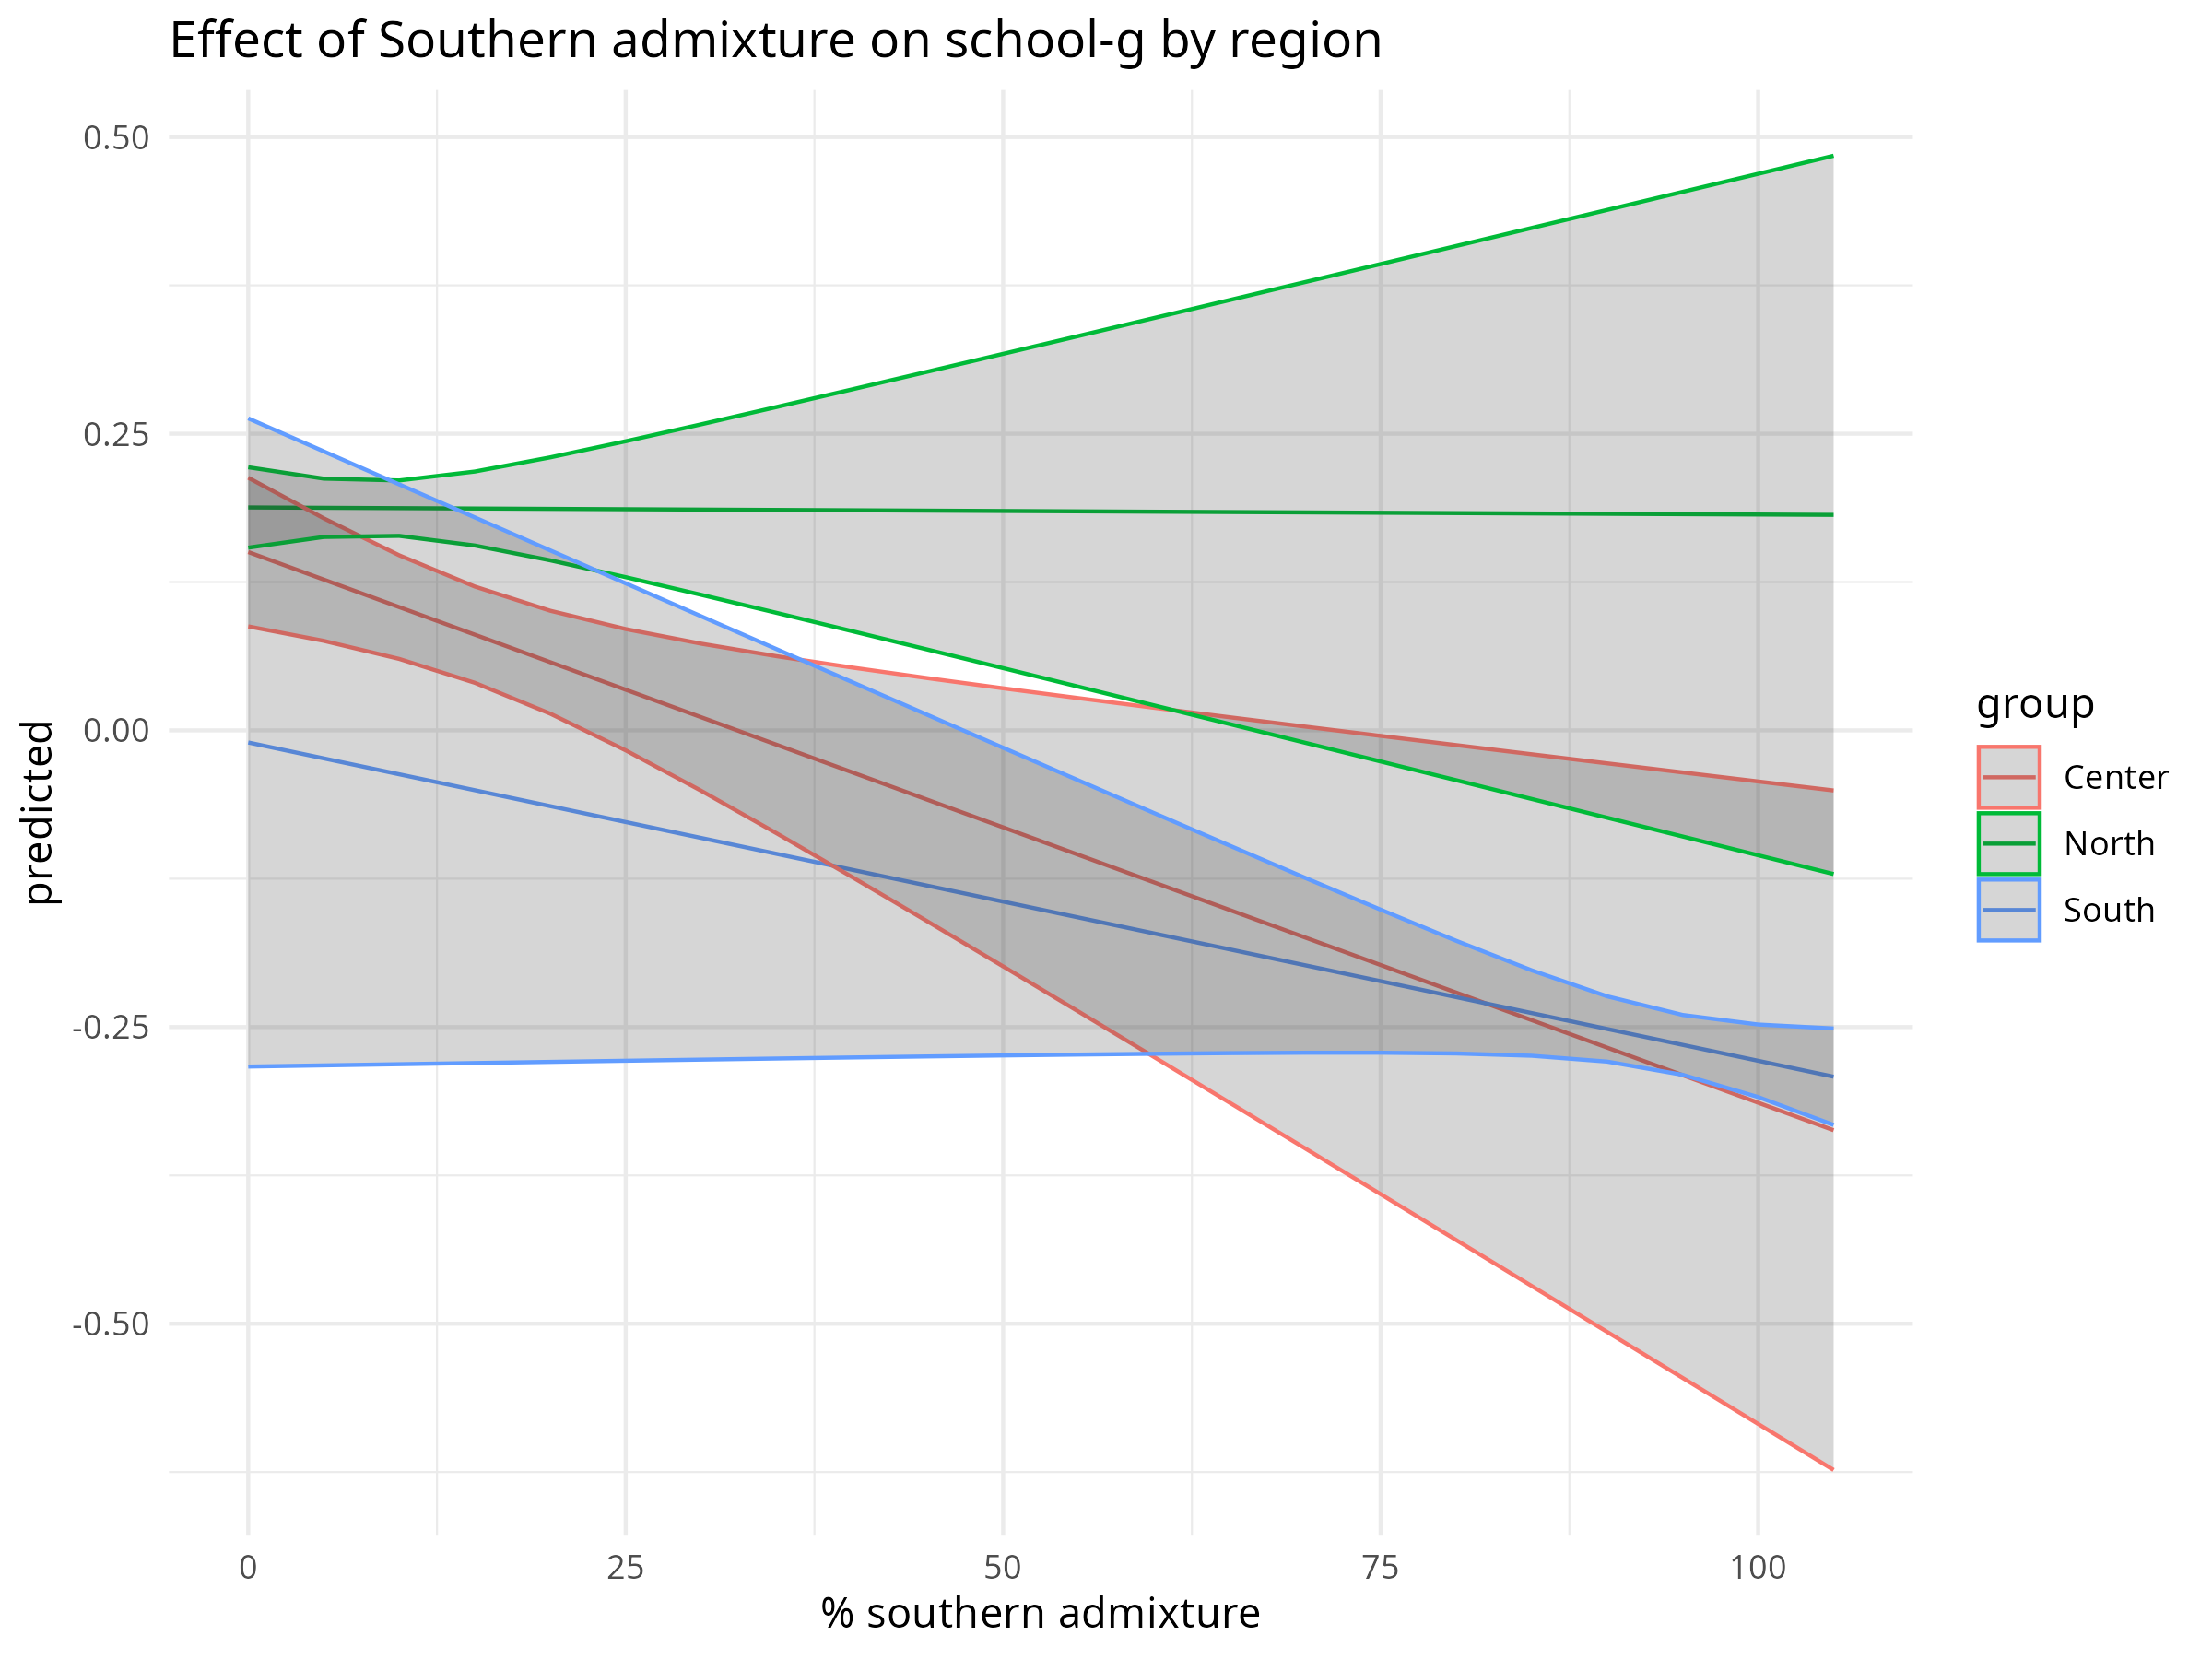
In the municipal analysis, we also find hints that regional context moderates the impact of Southern ancestry (Fig. 3). For example, municipalities in the North with a relatively high share of Southern surnames show less of a penalty than similar municipalities in the Center or South. One possible interpretation is that Northern environments, with better economic conditions and educational infrastructure on average, partly compensate for ancestry linked disadvantages. Another possibility is selective migration: historically, many of the Southerners who moved northward may have been positively selected for traits such as ability, motivation, or ambition. If this is the case, then Northern municipalities with large Southern-descended populations would contain a subgroup that is not representative of the South as a whole, which could help explain why the expected penalty is reduced in these areas.
We should keep in mind the interaction term is barely significant (p= 0.043), so it requires replication.
Figure 3
Continue reading → Become a paid subscriber to access the analysis of municipal-level patterns, selective migration of high-skilled Southerners into richer regions, and exceptional mathematical performance (Math Olympiad data), plus new evidence on the causal links between income and school performance. As a bonus, paid subscribers unlock:
🔍 Interactive province-level maps of standardized test scores
🏙️ Municipality-level data revealing hyperlocal patterns
