
Part II: The Four Races of Europe
How the Four Ancestries Shaped Europe’s Biological and Cognitive Landscape

In Part I, I outlined the four deep ancestral lineages that formed the genetic foundation of modern Europeans:
Levant–Mesopotamia Neolithic, Anatolian Farmer, Western Hunter-Gatherer (WHG), and Steppe or Yamnaya.
I also summarized recent findings, especially Pankratov et al. (2024), showing that these ancient layers still correlate with many complex traits in present-day Europeans, even when comparing siblings.
Part II moves from historical reconstruction to quantitative analysis. Here I use my dataset of about 4,000 ancient Western Eurasians to show how these ancestries actually shaped biological and cognitive traits through time.
In this section, I will present:
The four-way admixture plot, which visualizes how Levant–Mesopotamian, Anatolian Farmer, WHG, and Steppe components rise and fall across the Upper Paleolithic, Neolithic, Bronze Age and Iron Age.
This plot provides a direct picture of how Europe’s genetic landscape formed.Regression results for ancient polygenic scores, focusing on two traits of major importance: height and educational attainment.
These models estimate how polygenic scores changed across thousands of years of history.The role of geography and time, assessed by regressing polygenic scores on latitude and sample date.
This allows us to separate longitudinal trends from spatial patterns such as the WHG-rich north and the Farmer-rich south.Partial residual plots that reveal non-linear dynamics, including the sharp increase in height-associated alleles that appears with the arrival of Steppe ancestry after about 3000 BCE.
Together, these results show that Europe’s four ancestral lineages did not fade away after admixture.
They continued to shape trait variation during the Neolithic and Bronze Age and their influence is visible even in the genomes of modern Europeans.
We begin with the admixture plot, which provides the a guidance for what follows.
Plotting the Four Ancestries
To understand how the four deep ancestries vary across archaeological cultures, I generated four stacked bar plots. Each plot sorts the cultures by the mean proportion of one ancestry component. This allows us to see where each lineage peaks and where it reaches a minimum, and it reveals the characteristic cultural and geographic signatures of each ancestry.
1. Anatolian Farmer ancestry
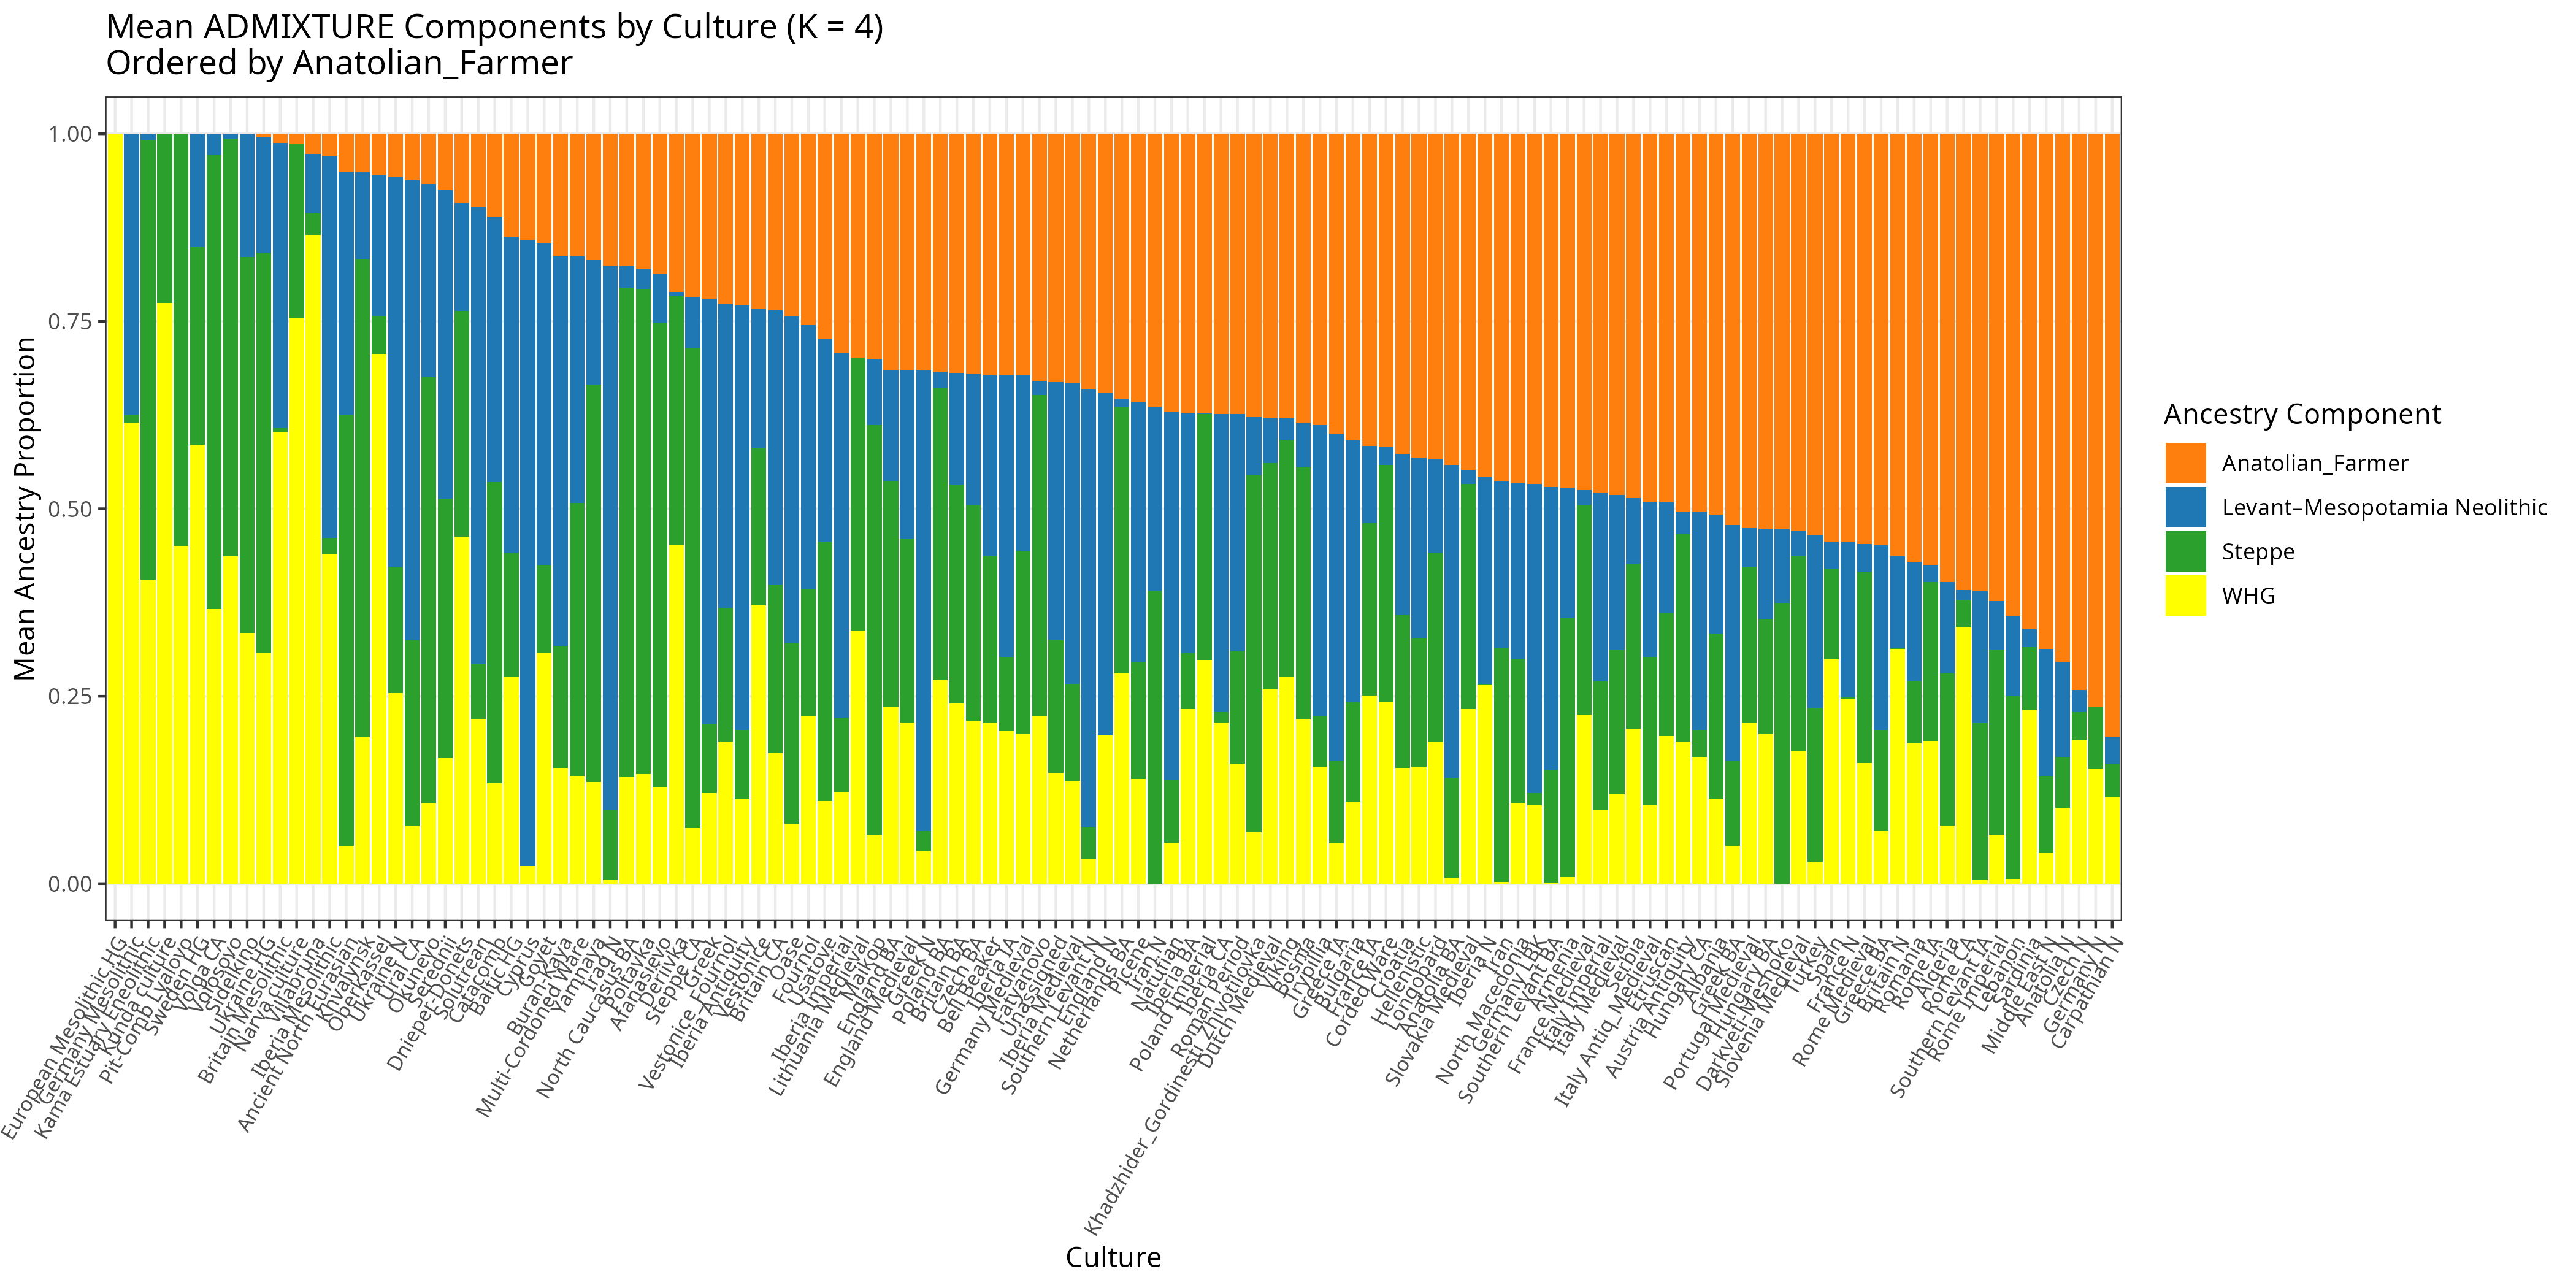
When cultures are ordered by Anatolian Farmer proportion, a clear pattern emerges.
The highest values appear in Neolithic and Chalcolithic farming groups from the Mediterranean and Central Europe, including early Iberian farmers, Italian Neolithic sites, Aegean groups, and Central European LBK or post-LBK farmers. These cultures are dominated by the orange section because the First Farmers were the primary carriers of this ancestry.
The nadir appears in Steppe cultures, Baltic hunter-gatherers, Scandinavian Mesolithic groups, and later Steppe-rich Bronze Age societies such as Corded Ware and Bell Beaker. These cultures show only modest Anatolian Farmer input until after the major Bronze Age admixture waves.
2. Levant–Mesopotamia Neolithic ancestry
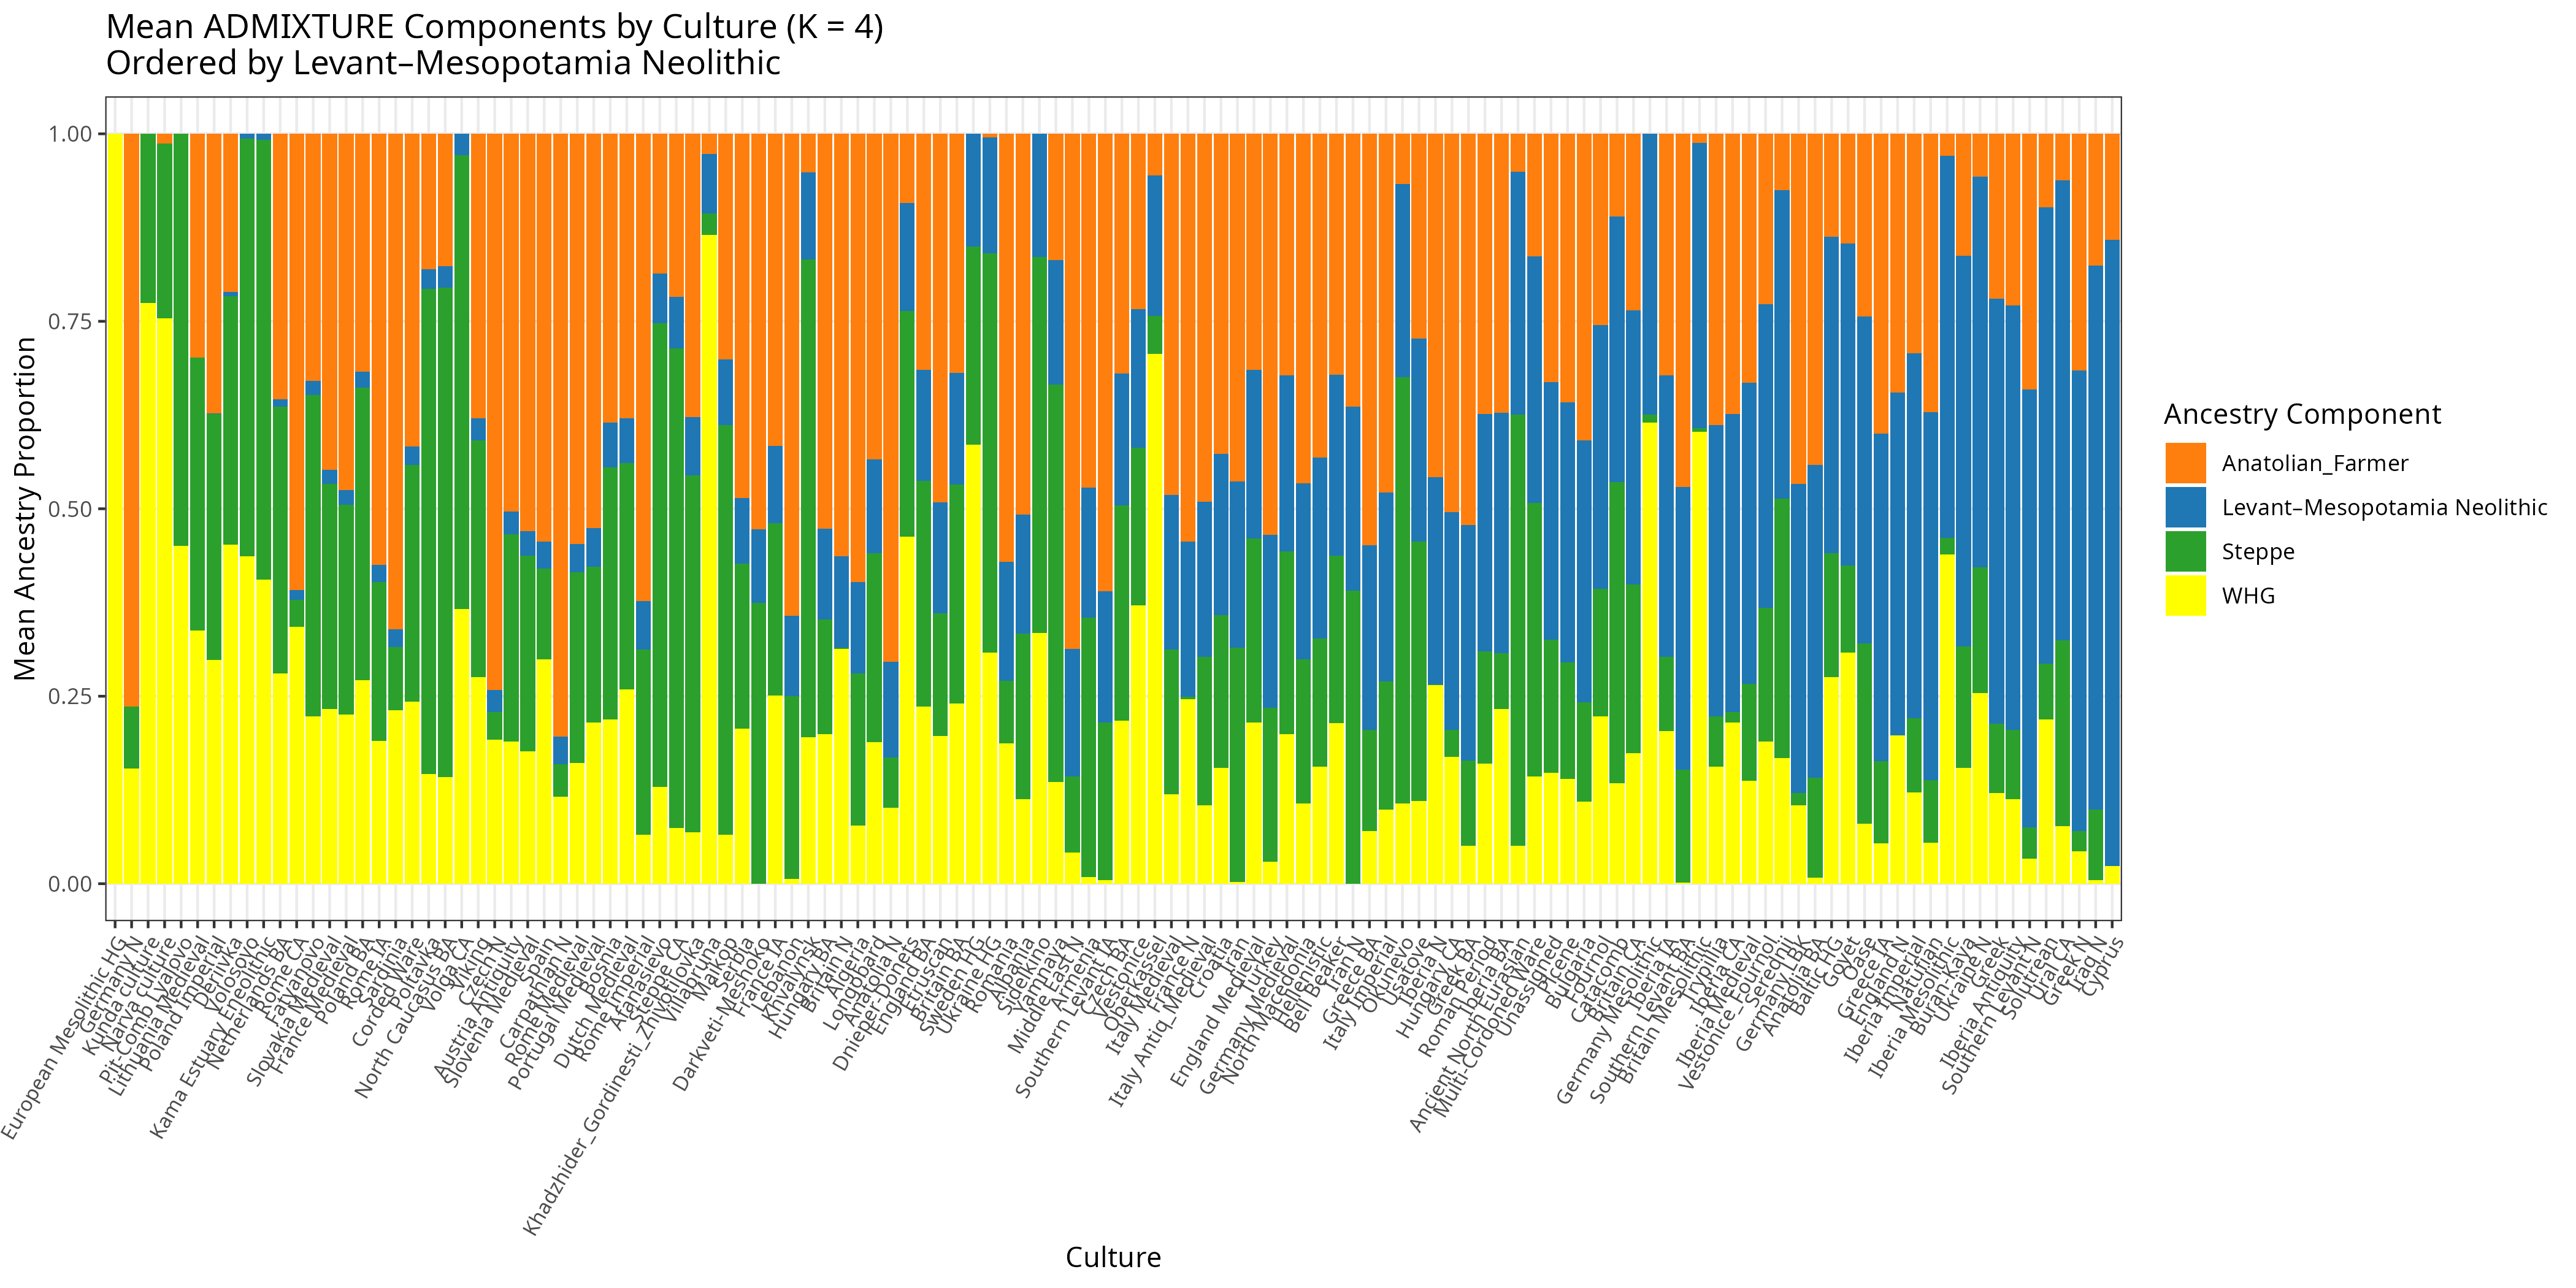
This ancestry peaks in Near Eastern and southeastern European cultures that are closer to the original Fertile Crescent domain.
High values occur in Anatolia, the Levant, the Caucasus, Chalcolithic Iran, and in some Balkan Neolithic sites. These populations contain the deepest Near Eastern signal that predates the spread of European farming.
The lowest values appear in western and northern hunter-gatherers, in Steppe cultures such as Yamnaya, and in WHG-rich groups from Scandinavia or the Baltics. In these societies the blue bar is minimal, reflecting their limited Near Eastern contribution before the Bronze Age.
3. Steppe ancestry
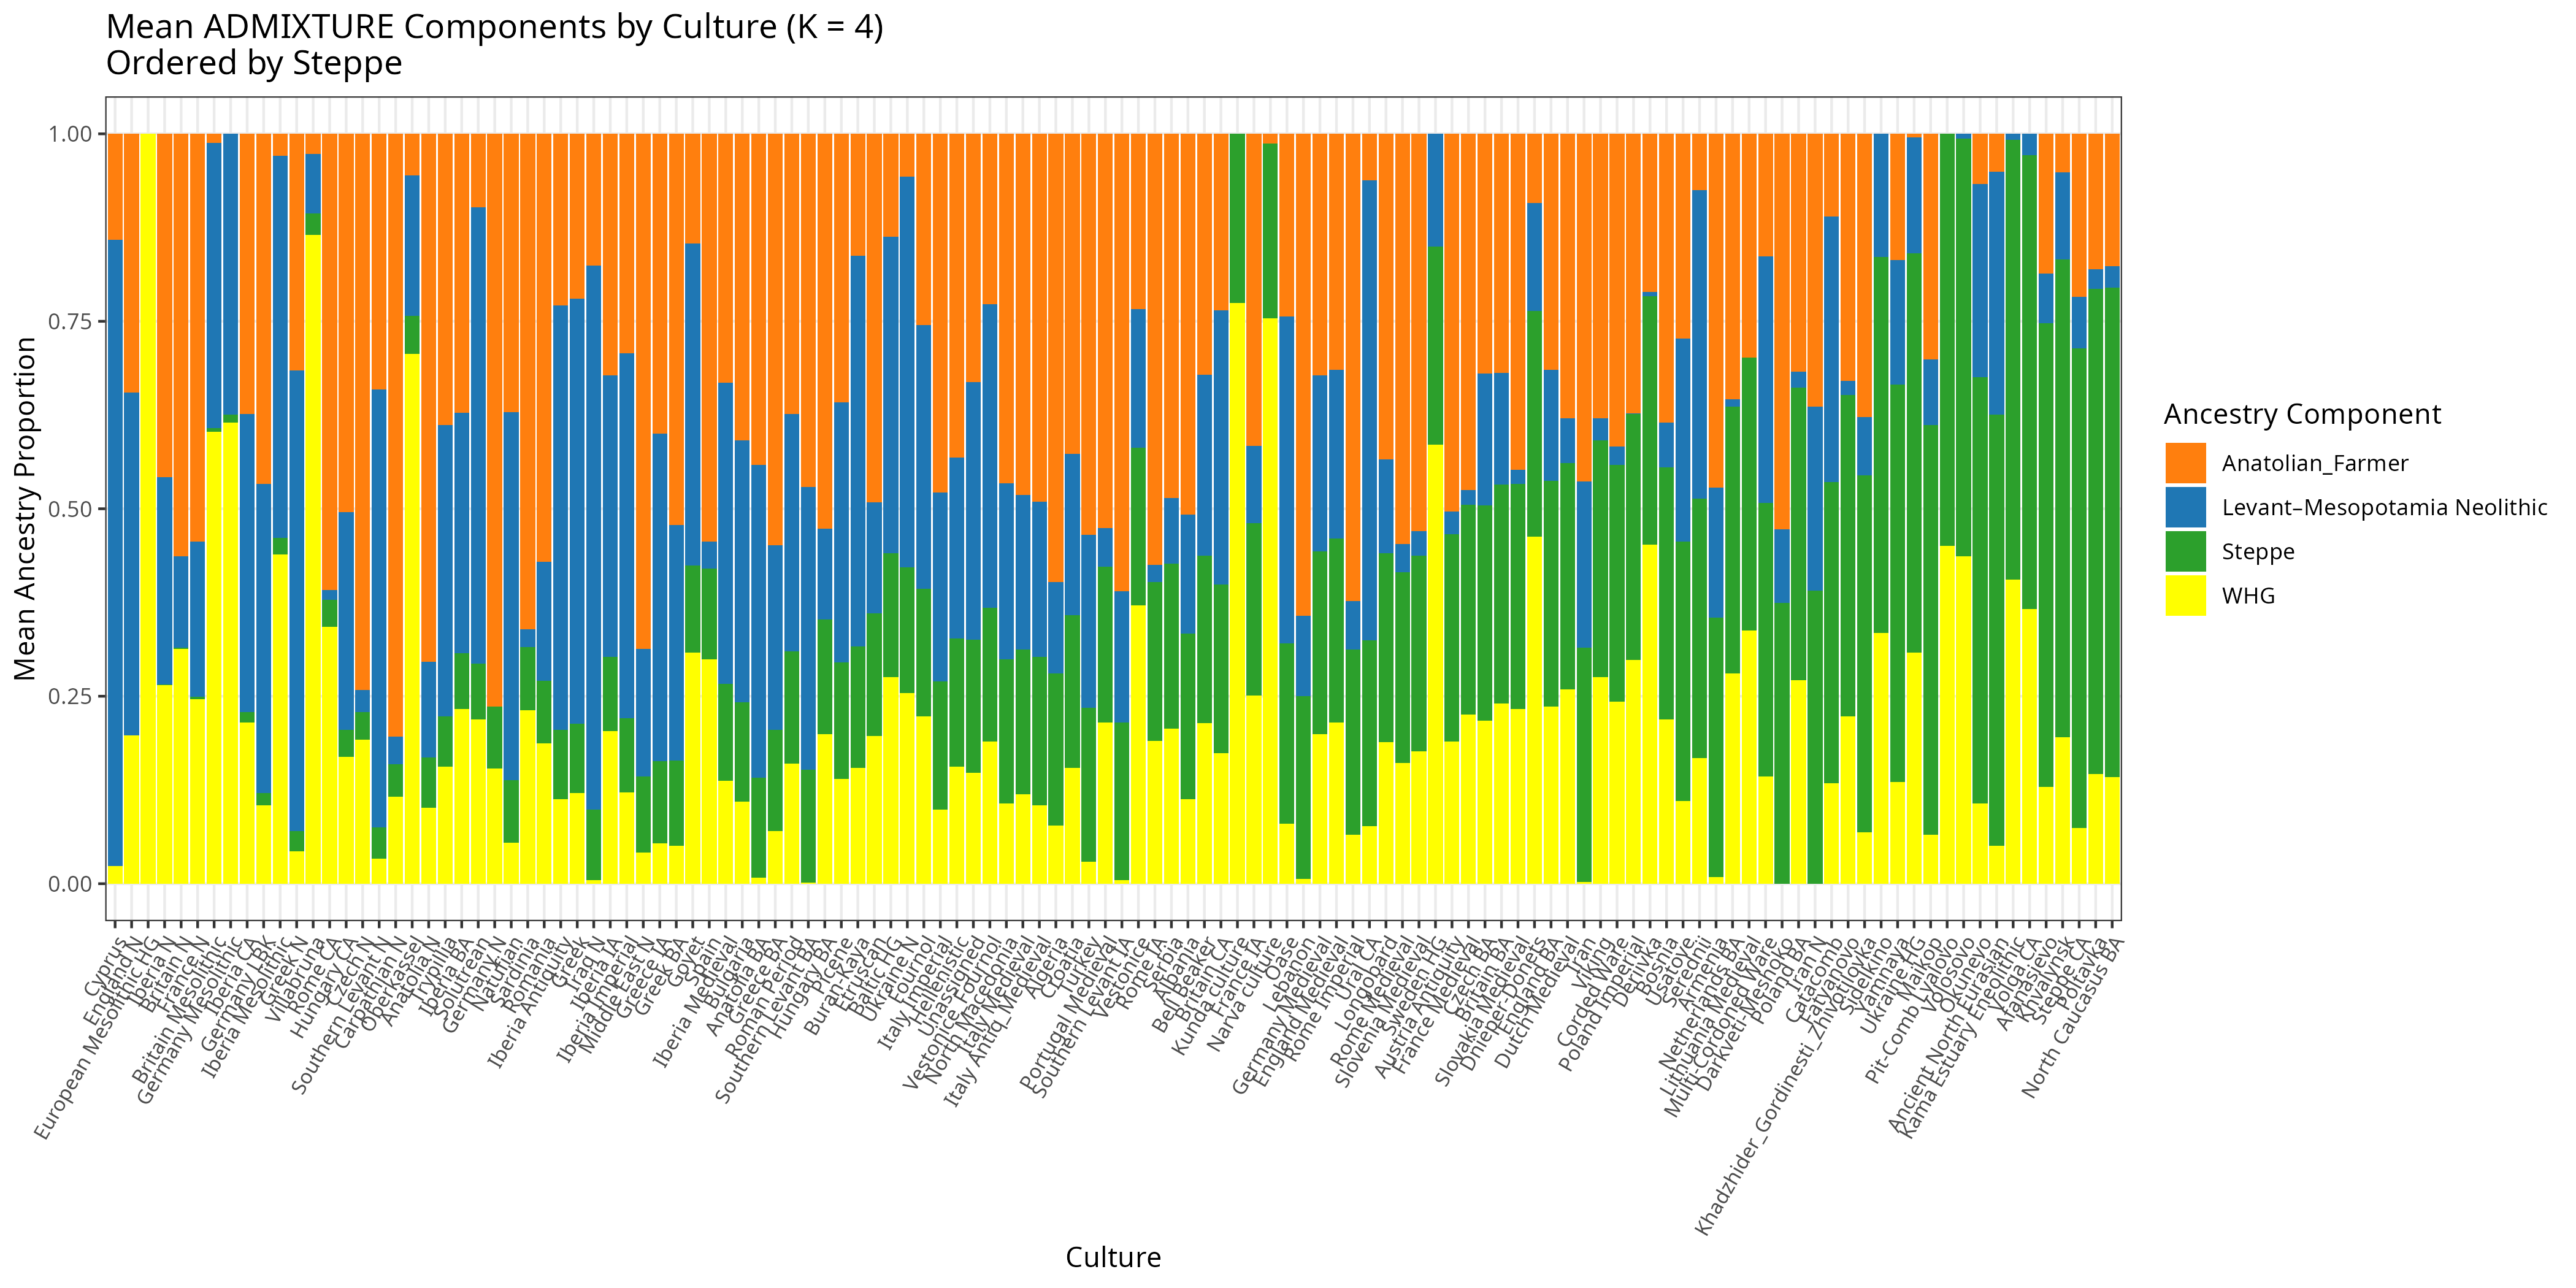
Ordering by Steppe ancestry highlights the explosive impact of Bronze Age migrations.
The highest proportions occur in Yamnaya and related Steppe cultures, followed by Corded Ware, Bell Beaker, and many Iron Age northern European groups.
The lowest values appear in early European farmers, Iberian Neolithic populations, and Near Eastern or Mediterranean groups. These cultures largely predate the Steppe expansions or were only lightly impacted by them.
4. Western Hunter-Gatherer (WHG) ancestry
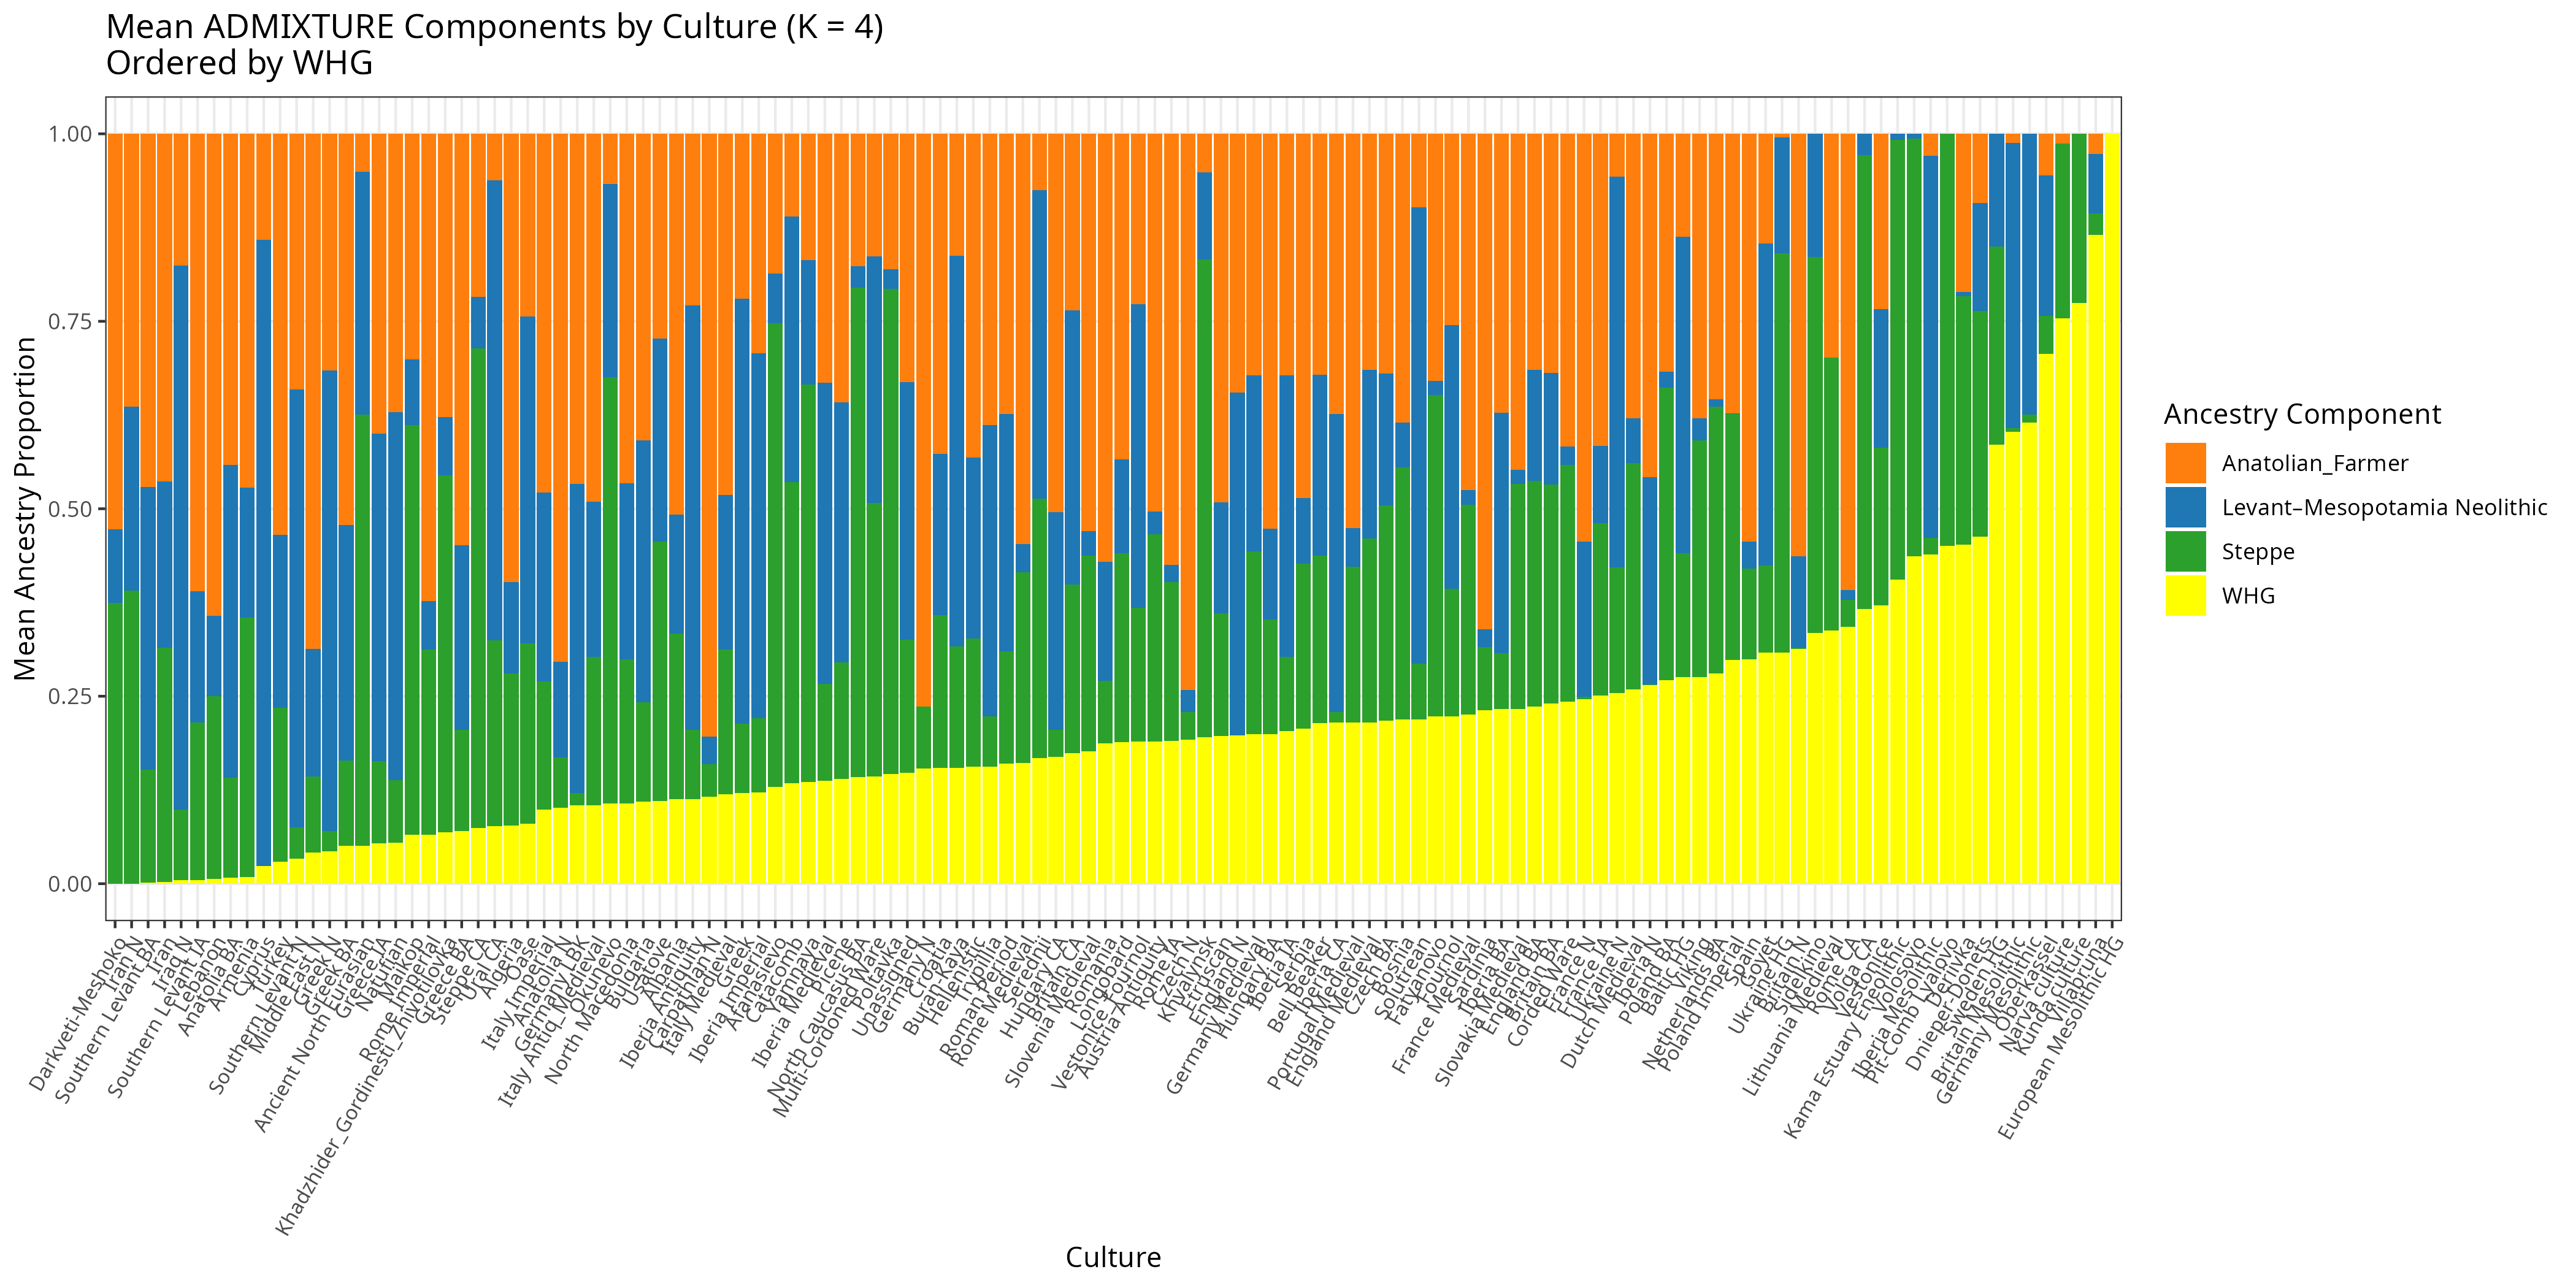
The highest WHG values occur in Mesolithic Europeans, Baltic hunter-gatherers, Scandinavian foragers, and some early post-Mesolithic northern groups. These cultures show a prominent yellow segment and represent the last descendants of Europe’s Ice Age lineages.
The lowest WHG values are found in Anatolian farmers, Near Eastern cultures, and southern Neolithic populations. In these groups, WHG ancestry is minimal because the first farmers had little genetic contact with European hunter-gatherers before entering the Balkans.
The rise of cognitive ability, height and the impact of the four lineages
In the rest of this analysis I walk through the key statistical results that connect Europe’s four ancestral lineages to the long-term rise in EA (Educational Attainment) -PGS and Height during the Holocene. Paid subscribers will see the partial-residual hinge regression plots that isolate the temporal break at 12,000 BP, along with the regression tables restricted to the Holocene period that provide the cleanest estimates of the per-century and per-ancestry effects. I also present a component-by-component breakdown showing how Anatolian Farmer, WHG, Levant–Mesopotamia Neolithic and Steppe ancestry contributed to shifts in both height- and cognition-associated variants. The section includes residualized plots, effect-size interpretations in real units (per century and per one percent ancestry), and an integrated discussion linking these genomic patterns to the archaeological and demographic transitions of the last 12,000 years. Together, these results offer the most complete statistical picture of how cognitive ability and height rose in prehistoric Europe and how the four deep ancestral lineages shaped that trajectory.
