Italy historical phase comparisons
Compare the Bronze Age background with later Celtic-associated affinity, inspect the Lombard-era northern rise and trace the Baltic assignments to named individuals. These are probabilities and continuous scores from the same four-reference PCA classifier used in the Italy atlas.
Prehistoric phase tests
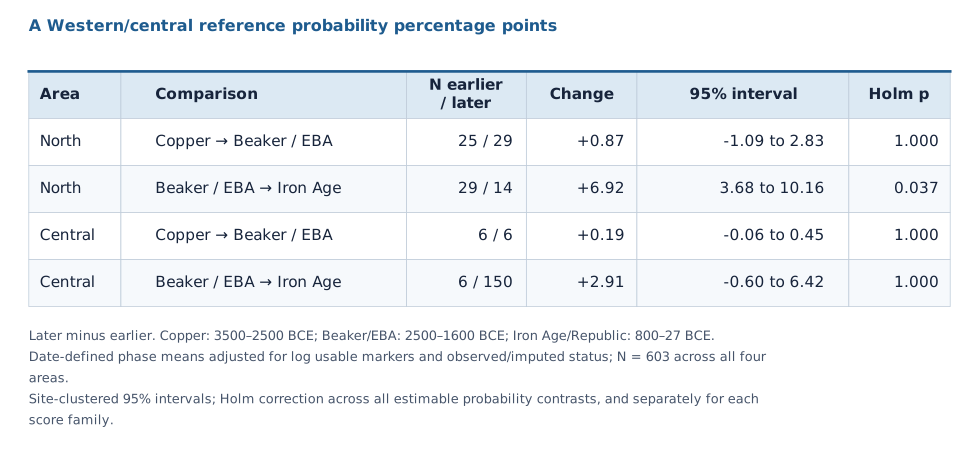
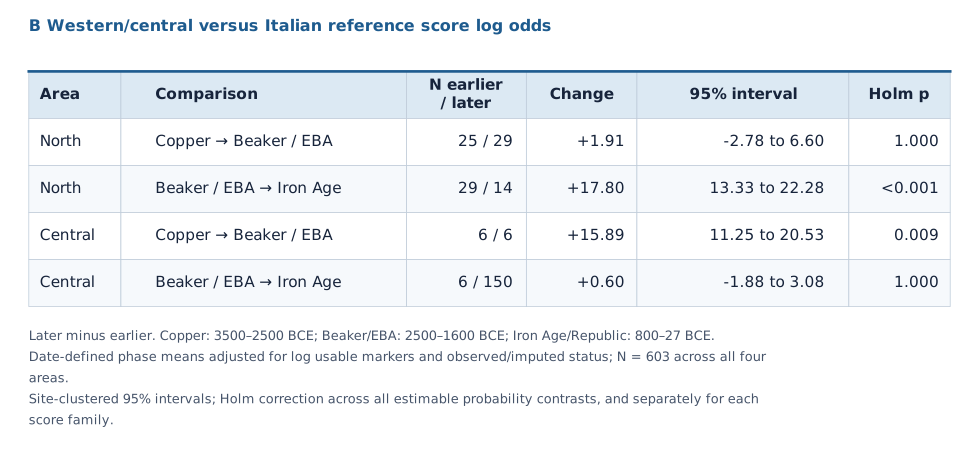
603 people dated from 7000 to 27 BCE, after five additional source aliases were joined. Models cover all four areas, four reference probabilities and three continuous comparison scores. Controls are log usable-marker count and observed/imputed status. The full dated inventory has 982 people; the revised recent trend has 839.
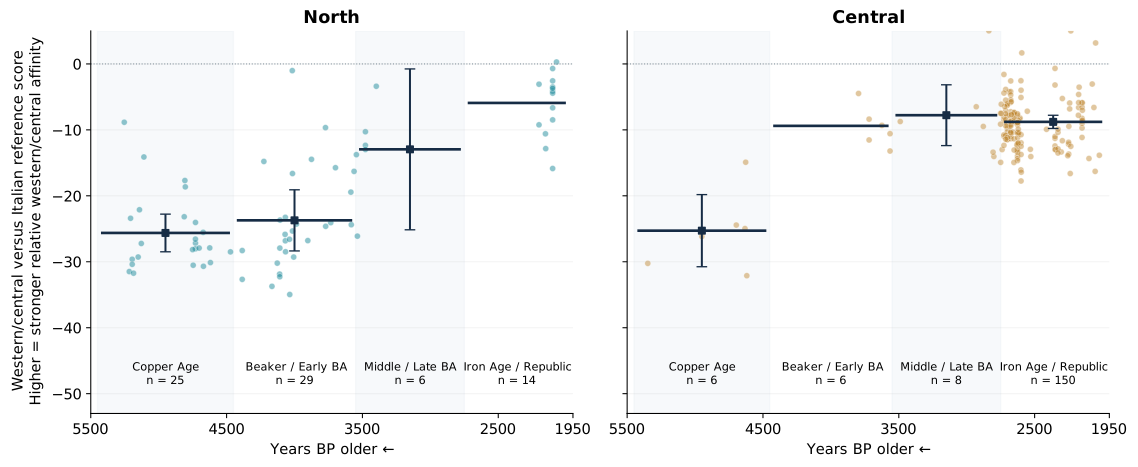
Dots: original individual values. Black markers: primary technically adjusted phase means, with site-clustered 95% intervals where at least three blocks are available. Selecting a sensitivity changes the contrast table below; the plot always shows primary means. Older samples are on the left.
| Later minus earlier | N earlier / later | Change | 95% interval | p | Primary Holm p |
|---|
Probability changes are percentage points; continuous scores are classifier log odds. The model fits linear phase means rather than a bounded probability curve. Holm correction spans 60 finite primary probability tests, and sixteen contrasts separately for each score. Non-estimable publication/period combinations are listed in the audit.
Historical migration checkpoints
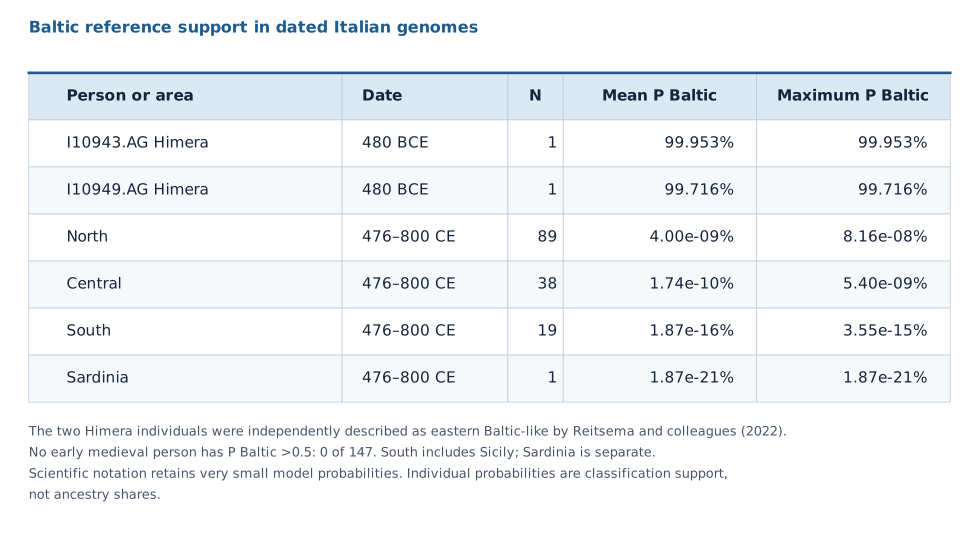
All 27 northern early medieval people with P Scandinavian >0.5 are from Collegno, dated approximately 600–747 CE, following the Lombard entry in 568. The two historical Baltic probabilities above 0.5 are Himera soldiers I10943.AG and I10949.AG, both dated to 480 BCE and independently identified as eastern Baltic-like in Reitsema et al. 2022. None of 147 early medieval people exceeds 0.5 for the Baltic reference.
| Area | Period | N | P Scandinavian >0.5 | P western/central >0.5 | P Baltic >0.5 |
|---|
Figures tables and exact values
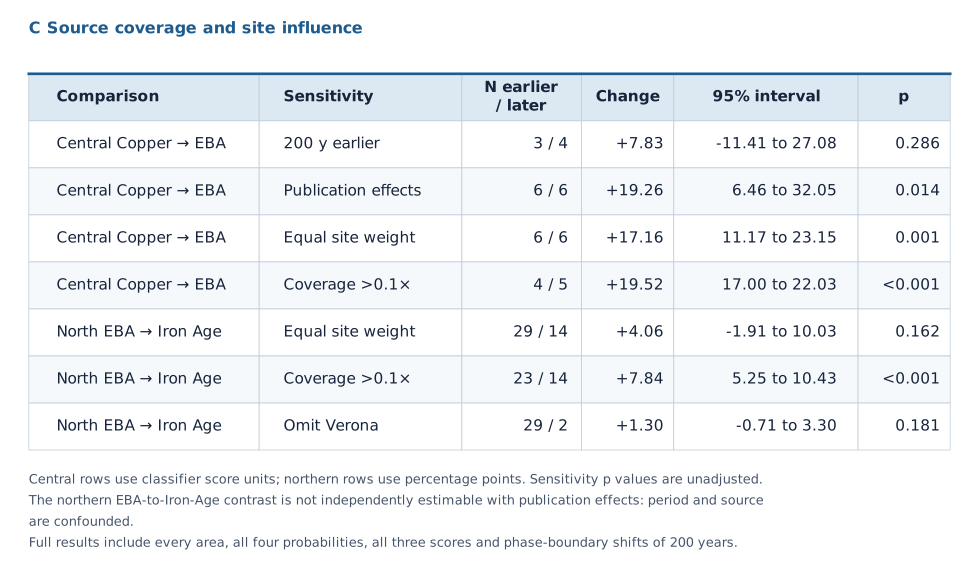
Table 3 contains the primary comparisons and source/site checks. Table 4 traces Baltic affinity at Himera and in the early medieval cohort. Files below contain full-precision estimates, all outcome and regional tests, source identities and technical barriers.
- Figure 4 plot values.csv
- Table 1 AB cells.csv
- Table 1 CD cells.csv
- Table 1 primary regressions numeric.csv
- Table 2 northern sensitivity cells.csv
- Table 2 northern sensitivity numeric.csv
- Table 3 A cells.csv
- Table 3 B cells.csv
- Table 3 Bronze Age contrasts all outcomes.csv
- Table 3 C cells.csv
- Table 4 Baltic evidence cells.csv
- Table 4 historical period results.csv
- adjusted individual probabilities.csv
- adjusted phase means.csv
- adjusted probability curves.csv
- all dated people with phases.csv
- historical Baltic high probability people.csv
- historical Scandinavian high probability people.csv
- historical phase inventory.csv
- metadata defined Beaker individuals.csv
- northern leave one site out.csv
- phase model estimability audit.csv
- regression average marginal effects.csv
- source alias reconciliation.csv
- trend model diagnostics.csv
- Figure 4 Bronze Age and Iron Age SVG
- Table 3 A SVG
- Table 3 B SVG
- Table 3 C SVG
- Table 4 Baltic evidence SVG
How the comparison is defined
Copper Age: 3500–2500 BCE; Beaker/Early Bronze Age: 2500–1600 BCE; Middle/Late Bronze Age: 1600–800 BCE; Iron Age/Republic: 800–27 BCE. Period labels define date windows rather than assigning a culture or language to each burial. Source aliases retain one genotype representation per documented sample identity; alternate records remain in the audit. The phase estimates compare sampled populations at different sites. Classifier probabilities measure relative support among the four reference distributions and are not ancestry proportions.